
These two pictures are ‘astro images’ of the star Vega which is found in the constellation Lyra (The Harp), one of the most prominent night sky asterisms from early Greek and Roman civilization and culture. It is also one of the brightest objects in the night sky after the Sun, Moon, Venus and the star, Sirius.
Until about the beginning of the 20th century, all astronomy, including professional studies, was basically descriptive and hand-drawn from hours of work spent at the eyepieces of a given telescope. However, since it was not going to go any further in this direction, it remained for astronomers like Henry Norris Russell and others to move astronomical studies into the realms of physics and emerging interpretations of Nature and the Universe such as Quantum Mechanics and the General and Special Theories of Relativity.
Along with this came the realization in chemistry studies, physical studies, geology and metallurgy that all substances have their own ‘fingerprints’, signatures or identities. These identities do not change whether the substance is in the laboratory or out in space. In other words they are universal.
Isaac Newton had done experiments with light using a glass prism. He discovered that light could be refracted into its component colours using one prism and then reassembled in whole using another one right after the first.
Since all substances have their own individual signatures they can be identified by the light they give off when heated or burned, and thus, revealed.
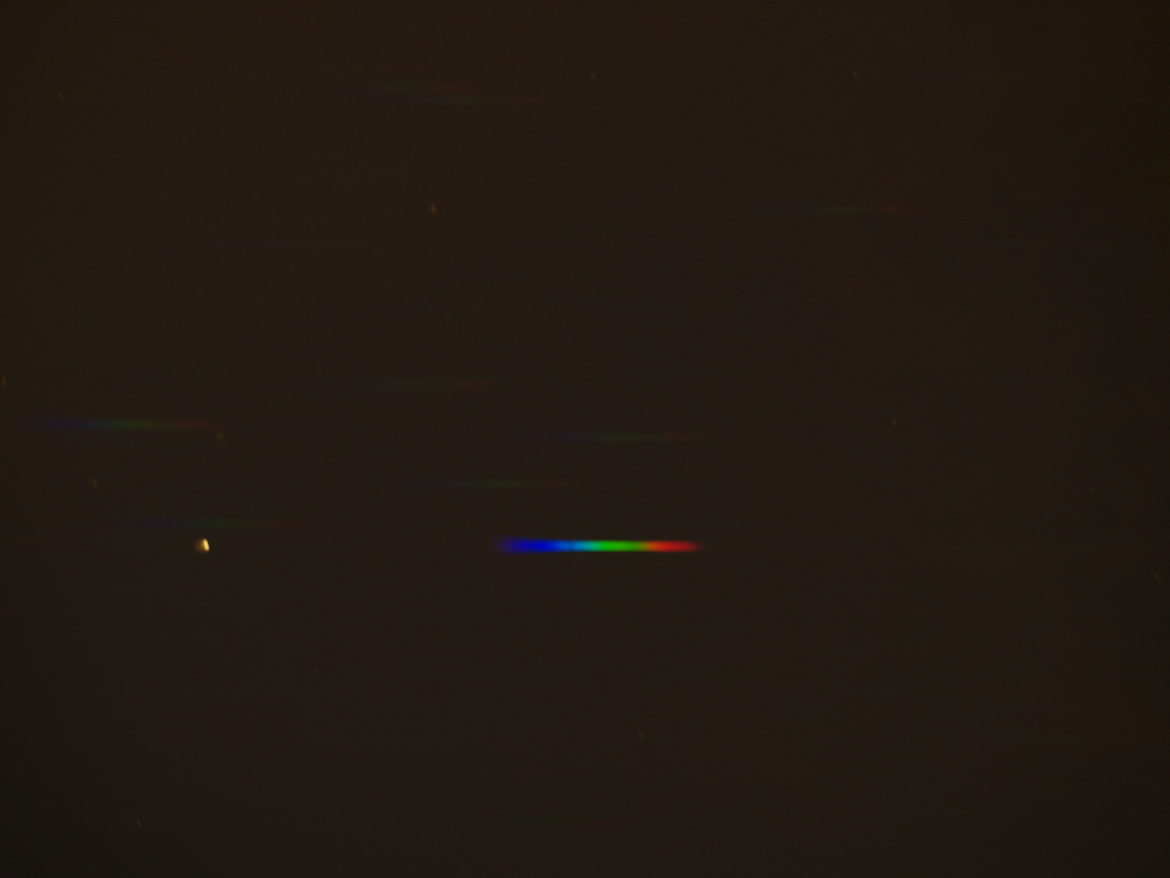
The first of our pictures is of Vega (above), taken with a camera, tripod, 30-second exposure, 55mm f1.2 lens and diffraction grating (a kind of more modern and more efficient glass prism). It depicts the star and its spectrum or colour signature.
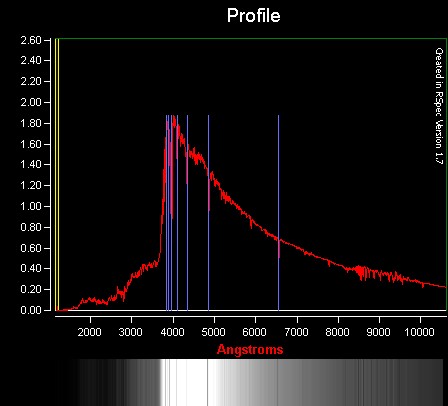
The second picture (below) is that spectrum put into a programme called “Rspec” (Real-time Spectroscopy) ‘designed and built’ by Tom Field, a software specialist from the west coast of the U.S. What it shows is as follows: a red flux-graph of the energy intensity in the different parts of Vega’s spectrum; blue lines to point out the energy frequencies at which hydrogen (the most abundant element in the universe) can be found in this star; and a black & white spectrogram of ‘lines’ (yup – hundreds of ’em!) showing where other elements can be located and how intense these are. The heavier the line, the more common the element.
So, what does all of this tell us, other than what has been listed above? We can classify all stars using this information. We can tell where they are in their life cycles. We can tell all of the ‘chemicals’ they contain and in what abundances. We can use this tool to look for life in the universe or tell whether exoplanets might be life-bearing. We can tell whether stars are coming toward us or retreating away from us. We can use it to do more advanced tests of Relativity, Quark Theory and Quantum Mechanics. Galactic evolution can be probed with it. It will enable us to do much more.
I became interested in this study about 13 years ago and did it using film. Today, like all astrophotography, it is digital. It is one very powerful tool for research and just plain astronomical ‘fun’ and personal discovery. In short it is probably the most important research tool in modern astrophysics and astronomy. It is like doing astronomy with a ‘microscope’.
Very nice article on a very interesting subject. Thanks Michael. Well done!