
Please scroll down to see previous activities in chronological order.
Why Soda Fizzes
The Aerodynamics of Flying a Frisbee
Build a Robot Hand
Imagine You’re an Astronaut
How Melting Ice Causes Sea Level Rise
Make a Water Filter
Build a Popsicle Stick Catapult
Make an Astronaut Lander
Make a Paper Mars Helicopter
Measuring the Supermoon
Why Is The Sky Blue?
Sunspot Cycles
Make Your Own Seismograph
The Antacid Rocket Experiment a.k.a Film Canister Rockets
Universe Cards
Make a Topographic Map
Make a Homemade Compass
How Does a Hovercraft Hover?
Make a Telescope
Generate Electricity with a Lemon Battery
Do-It-Yourself DNA
Seed Germination Experiment
Build a CD Spectrometer
Build a Rubber Band-Powered Car
Build a Hand Crank Winch
Phases of the Moon
How to Make a Sundial
Commercial Crew A to Z Activity and Coloring Booklet
De-Coding Starlight Activity: From Pixels to Images
Making Moon Craters with Moon Dough
Make a Stethoscope
Using Printable Star Charts With Kids
Balloon Magic with Bernoulli’s Principle
Build the Best Bridge
Make a Balloon-powered Nanorover
Make a Cloud in a Jar
Make a Pinwheel Galaxy Pinwheel
Design and Build Your Own Spacecraft
Grow Your Own Salt Crystals
Relative Sizes of Planets
Wednesday June 24, 2020 – Why Soda Fizzes — Boyle’s Law
Demonstration
Introduction
You have probably cracked open a soda before to see the liquid fizz right up out of the bottle, creating a huge mess. Why does that happen? It has to do with the carbon dioxide gas that is added to the liquid to make it fizzy. Opening the bottle releases the built-up pressure by the gas inside, causing the gas-liquid mixture to rush out the bottle. In this activity, you will demonstrate with the help of air- and water-filled balloons how a gas changes volume depending on its pressure.
Credits
Svenja Lohner, PhD, Science Buddies
Materials
- Small balloons such as water balloons (2, additional 2 optional)
- 60 mL syringe (without needle) Note: the syringe needs to be airtight.
- Scissor
- Tap water
- Food color (optional)

Prep Work
- Fill the syringe with water. Then fill one balloon with some of the water and tie its opening with a knot. Cut the neck off right above the knot. The balloon should still be small enough to fit into the syringe.

- Use the syringe to fill the second balloon with a little bit of air. It should be the same size as the water-filled balloon. Again, tie the balloon opening with a knot and cut off the remaining parts right above the knot.

Procedure
- Put the air-filled balloon inside the syringe at the very end. Insert the plunger into the syringe and try to push the balloon into the tip of the syringe.
How hard is it to push the plunger in? What happens to the air inside the syringe? - Pull the plunger back again and move the balloon into the middle of the syringe. Then close the front opening (the tip) of the syringe with one finger and push the plunger into the syringe again.
What do you notice? How does the balloon look or change when you push the plunger in?
- Release your finger from the tip of the syringe. Place the balloon into the tip of the syringe and push the plunger into the syringe until it touches the balloon. Then pull the plunger all the way back while again closing the tip of the syringe with your finger.
Does the balloon shape change? How? Can you explain why?
- Replace the air-filled balloon inside the syringe with the water-filled balloon. Then place the plunger into the syringe. Close the tip of the syringe with your finger and push the plunger into the syringe as far as you can.
How does the balloon change this time? - Release your finger from the tip of the syringe and push the plunger all the way into the syringe until it touches the balloon at the tip of the syringe. Then close the tip of the syringe again with your finger and try to pull the plunger back as far as you can.
What happens to the water-filled balloon? Does it behave differently than the air-filled balloon? If yes, how and why?
Cleanup
Discard the balloons into your regular trash. Clean out the syringe. You might want to keep it for another science experiment.
What Happened?
Did you see the air inside the air-filled balloon contract and expand? You should have! Without closing the tip of the syringe with your finger, you can easily push on the plunger. The air can escape through the opening at the tip of the syringe. However, when you close the syringe with your finger, the air can’t escape anymore. If you press on the plunger, you increase the pressure of the air and thus the air in the balloon contracts or decreases its volume. You should have seen the air-filled balloon shrivel up and get smaller in size. The opposite happens when you pull the plunger back while closing the opening of the syringe. This time, you decrease the pressure of the air inside the syringe and its volume increases. As a result, the air-filled balloon expands and grows in size. A perfect demonstration of Boyle’s law!
The results look different with the water-filled balloon. Although you are compressing the air inside the syringe when pressing on the plunger, the water inside the balloon does not get compressed. The balloon stays the same size. The water balloon also keeps its shape when pulling out the plunger while closing the tip of the syringe. In contrast to gases, liquids are not compressible as their particles are already very close together. Boyle’s law is only valid for gases.
When you filled the syringe with water as well, you still should have seen the air-filled balloon shrinking while pushing the plunger into the syringe. The air-filled balloon also should have expanded when pulling the plunger out while the tip of the syringe was closed. You might have noticed, though, that you were not able to push and pull the plunger in and out as far as you could with the air-filled syringe. This is again due to the fact that liquids cannot be compressed like gases. You should have observed that also when trying to push the plunger in or pulling it back in the water-filled syringe with the water-filled balloon. It was impossible to move the plunger in and out!
Digging Deeper
The difference between solids, liquids, and gases is how the particles (molecules or atoms) they are made of behave. Particles in solids are usually tightly packed in a regular pattern. Although the particles in a liquid are also close together, they are able to move freely with respect to one another. Gas particles, however, are widely spread out and occupy lots of space. They continue to spread to any space that is available. This means that in contrast to liquids and solids, the volume of a gas is not fixed. Robert Boyle, a chemist and physicist form the 17th century, discovered that the volume of gas, meaning how much space it occupies, is related to its pressure, and vice versa. He found that if you pressurize a gas at a constant temperature, its volume contracts. If you decrease its pressure, its volume increases.
You can observe a real-life application of Boyle’s Law when you fill your bike tires with air. When you pump air into a tire, the gas molecules inside the tire get compressed and packed closer together. This increases the pressure of the gas, and it starts to push against the walls of the tire. You can feel how the tire becomes pressurized and tighter. Another example is the soda bottle. To get carbon dioxide gas into the liquid, the whole bottle is usually pressurized with gas. As long as the bottle is closed, it is very hard to squeeze, as the gas is confined to a small space and pushes against the bottle’s walls. However, when you remove the cap, the available volume increases and the gas escapes. At the same time, its pressure decreases. If the gas/liquid mixture was shaken too much, the liquid would shoot out of the bottle together with the gas—and there you have the mess!
One rather important demonstration of Boyle’s law is our own breathing. Inhaling and exhaling basically means increasing or decreasing the volume of our chest cavity. This creates low pressure or high pressure in our lungs, resulting in air either getting sucked into our lungs or leaving our lungs.
For Further Exploration
- Use the same setup as in your experiment, but this time, add water to your syringe in addition to the air-filled and water-filled balloons. You can add a drop of food coloring to make the water more visible. Then close the tip of the syringe and try to press the plunger into the syringe and pull it out again. What happens this time? How does the water inside the syringe make a difference?
Wednesday June 17, 2020 – The Aerodynamics of Flying a Frisbee
Courtesy of https://www.sciencebuddies.org/

Introduction
Are you good at tossing a Frisbee? Have you ever wondered how a Frisbee is able to fly through the air so well? If you can throw a perfect, arcing curve, right on target, you have already trained your arm on the aerodynamics of Frisbee flight! In this science activity, you will investigate how the angle at which you throw the Frisbee affects its flight’s direction and distance. Next time you are out tossing a Frisbee, this little lesson in aerodynamics may help make your throws be even better!
Credits
Teisha Rowland, PhD, Science Buddies Ben Finio, PhD, Science Buddies
Materials
- A Frisbee
- Long string or hose
- Tape measure
- Large open area to toss a Frisbee in
- Optional: A helper
- Optional: A piece of paper and a pen or pencil

Prep Work
- Use the long string or hose to make a long, straight line in front of you, at least 25 feet long. You will be throwing the Frisbee so that it is directed down this center line.
- Practice throwing the Frisbee down the straight line a few times so you get used to tossing it. If you have not thrown a Frisbee much before, you may want to try practicing it for a little while. Tip: A good way to throw a Frisbee is by standing sideways with the Frisbee held in front of you (near the shoulder you are looking away from), then bringing the Frisbee horizontally across you as you throw it.
- If there is wind during any of your Frisbee throws, note the wind speed and direction.
Procedure
- Throw the Frisbee as flat and horizontal as you can, aiming it down the center line you made. You can have a helper watch to confirm the angle at which you throw the Frisbee.
How far did the Frisbee travel? How far did it travel away from the center line, and in what direction (left or right)? - If you have a piece of paper and a pencil or pen, you can record this data and all following flight data.
- Throw the Frisbee as flat and horizontal as you can at least four more times. Each time throw the Frisbee with similar arm motion and speed, use a similar spin, and have the same release point. How far did the Frisbee travel each time? How far did it travel away from the center line, and in what direction?

- Throw the Frisbee tilted up, aiming for between 1 o’clock and 2 o’clock (about a 45 degree angle up from the ground). Throw it this way at least five times. Other than changing the launch angle, try to keep all other aspects of the Frisbee flights the same. How far did the Frisbee travel each time when thrown at an upward angle? How far did it travel away from the center line, and in what direction?

- Throw the Frisbee tilted down, aiming for between 4 o’clock and 5 o’clock (about a 45 degree angle down towards the ground), at least five times. Again try to keep all other aspects of the Frisbee flights the same. How far did the Frisbee travel each time when thrown at a downward angle? How far did it travel away from the center line, and in what direction?

- Did you see a consistent relationship between launch angle and flight direction?
Is there a relationship between launch angle and distance? Why do you think you saw the relationships that you did?
What Happened?
To fly well, the Frisbee needs enough lift — which is the force that allows a Frisbee to stay in the air, and opposes the downward force of gravity — and not too much drag — which is the backward force on a Frisbee, going against its movement through the air. When a Frisbee is thrown tilted downward, it hits the ground sooner, so it does not have as much time to travel before it lands. As a result, it does not go as far. A Frisbee will go farther if you throw it horizontally or at an upward angle, since it will have a good amount of lift and will not crash into the ground right away. However, you may have noticed that if you throw a Frisbee up at too steep of an angle, it will probably stall out near the end of its flight, causing it to land gently and/or off to the side. When something flying through the air stalls, there is too much drag and not enough lift. Overall, the horizontal launches probably resulted in the overall “best” Frisbee throws in terms of distance and straightness.
Digging Deeper
Two key forces that act on a Frisbee during its flight are lift and drag. Lift is the force that allows the Frisbee to stay in the air, and it opposes the force of gravity on the mass of the Frisbee in flight. The Frisbee itself creates this lift force as it flies through the air. The Frisbee pushes air out of the way as it moves, and causes a slight downward motion of the air. The air pushes back up on the Frisbee, creating the lift force. Drag is a backward force on the Frisbee, and it goes against the Frisbee’s movement through the air, slowing it down. The force of drag acts perpendicular to the force of lift. The Frisbee’s shape, velocity, and angle at which it moves relative to the still air (called the “angle of attack”) all affect both the lift and drag.
As a side note, you have probably noticed that a Frisbee does not travel far if it is thrown without spin. Spinning the Frisbee helps it fly by supplying angular momentum, which helps keep the Frisbee stable while it is rotating. The faster it spins, the more stable it should be.
For Further Exploration
- In this activity, you investigated how the launch angle of the Frisbee affects its flight’s distance and direction, but you only tested a few angles. You can try this activity again but test even more angles, such as angles in between the ones you tried in this activity. You can video tape your throws and then watch the video to analyze and confirm the angles at which you threw the Frisbee. How well does the Frisbee fly using other launch angles? Is there an angle that consistently correlates with the “best” flight in terms of distance and stability?
- In this activity there was not a focus on the effects of wind on a Frisbee’s trajectory, but wind can definitely be a factor. How will the flight of the Frisbee be affected by throwing the Frisbee into the wind? What about across the wind or with the wind? How does the launch angle change the flight in each of these conditions?
- You could compare the flight of a Frisbee to the flight of an Aerobie (open ring flying disk). What differences do you notice? Can you explain them in terms of aerodynamic forces?
- The National Aeronautics and Space Administration (NASA) website has a great section on Aerodynamics. See The Beginner’s Guide to Aerodynamics.
Tuesday June 9, 2020 – Build a Robot Hand
Courtesy of https://www.sciencebuddies.org/
Note: This is an engineering design project. The procedure will show you one way to build a robotic hand, but this is just a suggested list of materials to get you started. You can modify the design and substitute other materials.
- Modeling clay. The clay can be reusable, air-dry, or oven-dry.
- Drinking straws
- String
- Tweezers
- Small rubber bands
- Paper clips
- Scissors
- Needle
- Cardboard tube
- Assorted objects to grasp

Procedure
- Follow along with the images below to build a simple robot hand with two “fingers” and one “joint” on each finger. However, note that this project follows the engineering design process. This is just a simple design to get you started. You can modify, test, and improve upon the design to make a better or more complicated robot hand.


2. Keep testing your robot hand and try using it to pick things up. Try objects of different shapes, sizes, and weights. Do you notice any problems with your design? Do you have trouble picking up certain items?
How could you change your design to make it better?
3. Try improving your design so it can do a better job picking up different objects. Is it better if you control all the fingers with one string, or individually? What if you change the angle of the fingers relative to each other, or the location of the joints? What else can you change?
4. If you are using air-dry or oven-bake clay, finalize your design before you let the clay dry. Caution: adult supervision is required for oven-bake clay. Putting plastic drinking straws in the oven may cause them to melt, depending on the baking temperature for the clay. If you notice any funny smells or see your straws melting, immediately turn off the oven and remove the robot hand.
What Happened?
Using the materials suggested in this activity, you should be able to build a robotic hand that can pick up small, lightweight objects. Objects that are slightly squishy or have rough textures (like a block of foam) may be easier to pick up than objects that are hard and smooth (like a table tennis ball). You may find it difficult to pick up heavy objects (like a coffee mug) because the straws are not sturdy enough and will bend backwards. The shape and variety of objects that you can pick up will depend heavily on how many fingers your hand has and how you arrange them. For example, you could build a hand that is very good at picking up paper cups, but has a hard time with table tennis balls, or vice versa. Building a robot hand that can easily pick up a wide variety of objects, like a human hand can, is a very difficult challenge that professional engineers are still working on to this day!
Digging Deeper
Your hand is made up of bones, muscles, joints, and tendons. The bones provide the rigid structure for the hand, like the straws in this project. The joints provide places for the fingers to bend, like the notches in your straws. The tendons pull on the joints to make the different segments bend, just like the string in your robot hand. The muscle in your robot hand is still provided by a human, since ultimately you are the one pulling on the paper clips. Real robotic hands have electric motors in them that act like muscles.
The science of developing robotic hands, along with other artificial limbs and organs, is called prosthetics. Scientists, engineers, and doctors work together to develop artificial body parts as replacements for people who lose organs or limbs due to accidents or disease. Try searching online for other types of prosthetic limbs and organs that have been developed. You might be amazed at what you find!
For Further Exploration
- Can you build a hand out of sturdier materials that can lift heavier objects? A trip to the hardware store might help you discover what materials you could use.
- Can you expand your robotic hand so it includes other joints? What about a wrist, or an entire arm including an elbow and shoulder
Tuesday June 2, 2020 – Imagine You’re an Astronaut
Courtesy of https://www.jpl.nasa.gov
Astronauts on the International Space Station, or ISS, often spend six to 12 months in space, orbiting Earth. It can be a little cramped staying inside the space station all that time. Astronauts still need to do their everyday living, such as working, eating, relaxing and exercising, but with fewer resources than they have on Earth.
Imagine you and your family are astronauts on the space station right now. You can only use the resources available to you. How would you adapt to the challenges and still keep doing important routines, like exercising, learning and making time for fun?
Watch the Tutorial
See below for materials and step-by-step instructions. For more video tutorials and activities like this one, visit Learning Space.

1. Keep learning
Astronauts are constantly learning. They do all the science experiments that need to happen on the space station. Most of the time, these experiments were designed by someone else, so astronauts need to learn about the science they are doing to follow the right steps and share the results. Astronauts also need to learn how to operate parts of the space station, such as the robotic arm.
How can you keep learning? Can you read a book? Do homework from your teacher? Have an astronaut read you a book?
Learn more about life on the space station here.
About the Image: NASA Astronaut Peggy Whitson looks at a soybean-plant growth experiment on the International Space Station.

2. Exercise
Astronauts need to keep their muscles strong when they’re in space. One way they do this is by running on a treadmill. The treadmill has bungee cords that hold the astronauts down so they don’t float away.
You can keep your muscles strong, too. Do some jumping jacks, pushups, situps, or walk and jog in place so that you’ll be strong enough when you can go exploring.
What other exercises can you do indoors? Make an exercise plan for yourself and your fellow astronauts and monitor your progress. Plus, learn more about how and why astronauts exercise in space.
About the Image: Astronaut Koichi Wakata exercises on the space station’s treadmill. Wakata is an astronaut with the Japan Aerospace Exploration Agency, or JAXA.

3. Observe Earth
Astronauts love to take pictures and videos of Earth from the window of the space station. Seeing Earth in new ways gets them thinking about what makes our planet unique and special.
You can take pictures from your window, too. Think about what makes your street, neighborhood or city unique and take note of the patterns you see. How are the trees and plants changing from day to day? How do the shapes and colors of the clouds change? (Identify what kinds of clouds they are and make a cloud mobile.) Do you see birds, squirrels or other creatures? What do you notice about them?
Here are some photos of Earth that were taken by astronauts.
About the Image: NASA astronaut Terry Virts takes a photograph from the window of the space station. Virts set the record for the most photos ever taken by an astronaut during a space mission.

4. Stay in touch
Astronauts keep in touch with their families by email and videoconference.
You can keep in touch with your family and friends by email, phone and video chat or by writing letters and drawing pictures. Make a list of the friends and relatives you want to stay in touch with. Call or write to a few people every day. They will be glad to know you are thinking about them. You can also keep a journal of what you do every day, just like the astronauts do.
About the Image: NASA astronaut Christina Koch shared this photo of herself relaxing on the space station after a busy work week.

5. Stay clean
We all need to stay clean, no matter where we are. We wash our hands with warm water and soap. We brush our teeth. We take baths or showers.
Astronauts have special ways to keep clean while they’re in space. Everything floats on the space station – even water! – so astronauts in space can’t just hop in the shower or use a sink to wash their hands, so they need to get creative. Watch this video to see how astronauts wash their hair in space. Watch these videos to learn more about an astronaut’s morning routine.
About the Image: NASA astronaut Catherine (Cady) Coleman washes her hair while aboard the International Space Station.

6. Get supplies
Every few months, a spacecraft travels up to the space station to bring supplies from Earth that astronauts need. During these “resupply missions,” astronauts get fresh fruit – a real treat! – new experiments to work on, clean clothes to wear, clean water to drink and food to eat until the next resupply mission comes, plus a few other treats from home.
If you could plan a resupply mission for your home, what would be the most important items to include?
About the Image: NASA astronaut Scott Kelly poses with fresh fruit brought to the space station during a resupply mission.

7. Take time for fun
Relaxation and fun are important, whether you’re in space or on Earth. Astronauts have some time every day to relax and do whatever they enjoy most.
Learn more about some of the hobbies astronauts do in space. Learn how some of your favorite toys behave in space.
What do you like to do for fun? What activities are most relaxing for you?
About the Image: NASA astronaut Steve Swanson and German astronaut Alexander Gerst play soccer on the space station as they get ready to cheer for their teams in the 2014 World Cup.

8. But wait, there’s more!
Here are some things you can do at home that astronauts on the space station can’t do:
- Open a window. This is definitely not recommended for astronauts, who have the vacuum of space outside their window!
- Breathe fresh air. Although the air on the space station is filtered, it’s the same air that’s been there for more than 20 years.
- Wash your clothes. Can you believe there’s no way to do laundry in space?
- Walk. Okay, floating is cool, but sometimes it’s nice to be able to walk around.
What else can you think of that you can do but astronauts in space can’t do?
About the Image: President Richard Nixon welcomes the Apollo 11 astronauts (from left), Neil A. Armstrong, Michael Collins and Edwin (Buzz) E. Aldrin, after their return from the Moon in 1969. The astronauts were required to spend 21 days in quarantine to be sure nothing hitched a ride with them from the Moon.

Explore More
- Stay hydrated! Astronauts need to drink water when they’re in space. So do you. Drink lots of water. If you wonder how water acts differently on the space station than it does on Earth, watch this video by astronaut Chris Hadfield.
- Grow food. Astronauts are learning how to grow food in the microgravity of space. Astronauts on the space station conducted experiments to grow tomato seeds and basil seeds in space. Students grew seeds on Earth at the same time to compare how they grew in both environments. You can plant seeds and grow your own fruits and vegetables. Learn more about astronauts growing plants in space.
- If you have flour, water and salt, you can make your own play dough. You can sculpt your own planets, moons, rockets, satellites, astronauts and more. Here’s a scale model of the solar system you can make with play dough.
- If you have paper, you can learn how to do origami, the Japanese art of paper folding. Did you know that NASA has origami experts who help figure out how to fit large spacecraft into the tight spaces on rockets?
- If you have paper and a pencil, crayons, colored pencils, markers, pastels, chalk or other art supplies, you can draw planets and moons.
- If you have empty tissue boxes or other cardboard, paper towel tubes, scissors and glue, you can design your own Mars rover.
- If you have access to a computer, you can explore all of the planets in the solar system and the NASA spacecraft that study them with free NASA’s Eyes on the Solar System software.
Thursday May 28, 2020 – How Melting Ice Causes Sea Level Rise
Courtesy of https://www.jpl.nasa.gov
You might have heard that melting ice contributes to sea level rise. But it makes a difference whether that melting ice is on land or in the sea.
Make a prediction about what each type of ice will do to the level of water in a container. Then build a model to compare what you predicted to what you observe.

Materials
- Two identical, clear plastic containers (about 6 inches by 6 inches)
- Clay, play dough (download recipe) OR small rocks (enough to create a 1-2 inch high surface that fills about a quarter of each container)
- Tray of ice cubes
- Ruler
- Cold water
- Piece of paper OR data sheet – Download PDF
- (Optional) permanent marker
*Don’t worry if you don’t have all of the materials. Get creative and substitute materials with what you have! It’s all part of the design process.

1. Think about ice
Consider where on Earth ice naturally occurs. Make a list of a few places where you might find ice in nature, and sort it into two categories: ice that is on land and ice that is in the sea.

2. Make a prediction
On the data sheet or a blank piece of paper, write down your prediction for which type of ice – land ice or sea ice – contributes more to sea level rise.

3. Set up your experiment
- Press equal amounts of clay into one side of both plastic containers, making a smooth, flat surface representing land rising out of the ocean. If you don’t have clay, try using some rocks to create a “land” surface on which you can place several ice cubes.
- In one container, place as many ice cubes as possible on the flat clay or rock surface. This represents land ice.
- In the other container, place the same number of ice cubes on the bottom of the container, next to the clay. This represents sea ice.
- Pour cold water into the sea-ice container until the ice floats. Be sure no ice is resting on the bottom of the container and that the water isn’t higher than the land level.
- Without disturbing the ice cubes, pour water into the land-ice container until the water level is about equal to the water level in the sea-ice container.

4. Begin your observations
- Using the ruler, measure the water level (in millimeters) in each container and record the data on your data sheet or piece of paper.
- You can mark the water level with a marker on the outside of the container, but remember the ink might not come off. Another way to mark the water level is to make a line in the clay using a pencil or other object.
- At regular intervals – maybe every minute or five minutes – measure the water level in each container again and record it on the data sheet. Compare the water level with the marked line on the side of the container or in the clay. Allow the ice in both tubs to melt completely.
- Use the measurements recorded on the data sheet to create a line graph representing the water level in each tub. You can do this using paper or on a computer with spreadsheet software.

5. Draw a conclusion
Think about what your observations mean for melting ice around the planet and how it contributes to sea level rise. Try to answer these questions:
- In which container did the water level rise more?
- How does this compare to your prediction?
- Why do you think this occurred?
- Does the melting of Earth’s glaciers on land contribute to sea level rise?
- How about the melting of icebergs at sea?
About the image: The graph above shows global sea level rise as measured by Earth satellites from 1993 through 2020. See the latest trends and explore more vital signs on the NASA Climate website.

6. Explore more!
Visit some of these websites to learn more about sea level rise and climate change:
- NASA Climate Kids
- NASA Climate website
- NASA Sea Level Rise website
- Sea Level Rise infographic
Monday May 25, 2020 – Make a Water Filter
Courtesy of https://www.jpl.nasa.gov
Design and build a device that can clean a dirty water sample using materials around your home. You’ll follow the same design process used by NASA engineers and scientists when they developed the water filtration system for the International Space Station orbiting Earth. To do so, you’ll use an iterative process, meaning you’ll test multiple designs, look at how your materials get you closer to your goal, and record your findings to build the best filter possible.
Important safety note! This activity is not designed to make drinkable water. No matter how “clean” your filtered water looks, you should never drink it because it still may contain pollutants you can’t see.
Watch the Tutorial
See below for materials and step-by-step instructions. For more video tutorials and activities like this one, visit Learning Space.

Materials
- 1-2 empty plastic water bottles
- Scissors
- Towel or paper towels (for spill clean up)
- Cheesecloth or gauze to cover the mouth of the bottle
- Rubber bands
- Any materials you think will make a great filter (cotton balls, sand or gravel, uncooked pasta noodles, coffee filters, etc)
*Don’t worry if you don’t have all of the materials. Get creative and substitute materials with what you have! It’s all part of the design process.

1. Create a dirty water sample
Start by preparing the water you’re going to filter. This can be done in many ways that change how difficult it is to filter the water. For example, mix some soil or dirt with tap water for an easier challenge. Try also adding food coloring or vinegar for a bigger challenge.
This dirty water sample will simulate wastewater. On the space station, this wastewater is made up of everything from the fuel that powers the station to astronauts’ sweat.

2. Build your filter cartridge
Until a few years ago, water needed to sent up to the space station in large containers the size of duffel bags. But in 2010, a filtration system was installed that made it so that water could be cleaned and reused onboard the space station.
To build your own filtration system, you’ll need a filter cartridge. Start by carefully cutting your water bottle in half, across the width of the bottle. Remove the cap from the bottle. Put gauze or cheesecloth over the opening and secure it with a rubber band. Turn the top half of the bottle upside down (so the part with the cheesecloth or gauze is facing down) and place it into the bottom half of the bottle.
If you want to fit more materials in your filter, you can use two bottles. You can also use larger bottles or try other containers. Note: Clear containers will help you see the filtration as it takes place.

3. Design your filter
The filtration system on the space station has several stages that first filter out larger debris, then smaller impurities and even bacteria. You may want to use similar layers in your filter.
Mix or layer the filter materials you’ve collected in the top of your filter cartridge. Write down what filtration materials you use and how much.

4. Test and evaluate the results
Pour your simulated wastewater into your filter and observe the water that comes out at the bottom of the filter. How effective was your filter at cleaning the water? Write down what you notice. How long did it take to filter the water? What worked well? What could be improved?
Important safety note! No matter how “clean” your filtered water looks, you should never drink it because it still may contain pollutants you can’t see.

5. Revise and try, try again!
Revise your filter based on what you saw during the last step. Then, test it again. Consider using the same amount of wastewater for each test so you can better evaluate how well your filter is working not just in terms of the color of your filtered water, but how much you’re able to clean, or reclaim.
The filtration system on the space station reclaims 93% of the water onboard. Every drop counts!
As you revise, you’ll find that some filter materials work better than others – not just at filtering out solids like dirt, but also in removing colors. Keep redesigning and testing your filter. Your goal is to produce as much clean water as possible during a single time through the filter.
Remember: Do not drink the dirty or filtered water!
Tuesday May 19, 2020 – Build a Popsicle Stick Catapult
Courtesy of https://littlebinsforlittlehands.com
Who knew STEM and physics could be so much fun? We did! Want to learn how to make a catapult with popsicle sticks? This Popsicle stick catapult design is an AWESOME STEM activity for kids of all ages! Exploring physics has never been so exciting for kids because everyone loves to launch stuff into the air. A catapult made out of popsicle sticks is the perfect kids’ activity for simple physics.

HOW TO BUILD A CATAPULT
These Popsicle stick catapults make a great STEM activity! We used technology to assist us in building our simple catapults. We used math to determine the supplies needed to build the catapults.
We used our engineering skills to actually build the popsicle stick catapults. We used science to test how far the catapults flung the items we chose.
Which Popsicle stick catapult fired the farthest? Great start to finish STEM activity with simple physics science play at the end!
MORE CATAPULT DESIGNS
Explore physics and how catapults work with other design ideas including:
- LEGO catapult
- Jumbo marshmallow catapult.
- Pencil catapult for great STEM with a handful of school supplies).
- Spoon catapult with great firing power!
POPSICLE STICK CATAPULT SUPPLIES:
- 10 Jumbo Popsicle Sticks
- Rubber Bands
- Firing Power (marshmallows, pompoms, pencil top erasers)
- Plastic Spoon (optional
- Bottle Cap
- Sticky Dots

HOW TO MAKE A CATAPULT WITH POPSICLE STICKS
STEP 1: Make predictions. Which object will fly the farthest? Why do you think one will fly farther than the other?
STEP 2: Hand out supplies to each individual or in small groups, and build a Popsicle stick catapult following the instructions below.
Read more about the science behind the catapult and simple ways to create a catapult science experiment below!
STEP 3: Test and measure how far each item goes when flung from the catapult. Record results.
This is a simple and quick Popsicle stick catapult using just two supplies. The best part is that you can also grab the supplies at the dollar store! Check out how we stock our dollar store engineering kit.
Adult supervision and assistance is highly recommended when using scissors.

You will want to use a pair of scissors to make two v notches on either side of two jumbo craft or Popsicle sticks (in the same place on both sticks). Use the photo below as a guide for where to make your notches.
Adults: This is a great step to prep ahead of time if you are making these popsicle stick catapults with a large group of kids.

Once you have made your notches in two of the sticks, set them aside!
Take the remaining 8 craft sticks and stack them one on top of the other. Wind a rubber band tightly around each end of the stack.
Go ahead and push on of the notched sticks through the stack under the top stick of the stack. Make sure to watch the video again to see this done.

At this point flip your partially made popsicle stick catapult over so that the stick you just pushed in is on the bottom of the stack.
Lay the second notched stick on top of the stack and secure the two popsicle sticks together with a rubber band as shown below. The V notches that you cut help to keep the rubber band in place.

Create more leverage with your catapult by pushing the stack of popsicle sticks towards the notched ends connected by the rubber band. Read about the science behind this below!

VARIATION: You can also make a popsicle stick catapult with a spoon which is especially great for holding objects like plastic Easter eggs or fake eyeballs. Check out two ways to place the spoon below!

TURN IT INTO A SCIENCE EXPERIMENT!
You can easily set up an experiment by testing different weighted items to see which ones fly farther. Adding a measuring tape encourages simple math concepts that my 2nd grader is just really starting to explore.
Or you can build 2-3 different catapults and see which one works better or if one works better with different objects.
Always start out asking a question to come up with a hypothesis. Which item will go farther? I think xyz will go farther. Why? Have fun setting up a catapult to test the theory! Can you design a different catapult using the same materials?
This is an awesome way to reinforce what the child is learning with a super fun activity. Additionally, you can encourage older kids to record the data from measuring all the launches.
Have your kids fire each material {such as a candy pumpkin, plastic spider or eyeball} 10 times and record the distance each time. What kinds of conclusions can they draw from the information gathered? Which item worked the best? Which item didn’t work well at all?
You can also test out the number of popsicle sticks used in the stack to create the tension need to launch the catapult. How about 6 or 10! What are the differences when tested?
THE SCIENCE OF HOW TO MAKE A CATAPULT!
This is a great simple physics activity for kids of multiple ages. What is there to explore that has to do with physics? Let’s start with energy including elastic potential energy. You can also learn about projectile motion.
Newton’s 3 Laws of Motion: An object at rest stays at rest until a force is applied, and an object will stay in motion until something creates an imbalance in the motion. Every action causes a reaction.
When you pull down the lever arm all that potential energy gets stored up! Release it and that potential energy gradually changes over to kinetic energy. Gravity also does its part as it pulls the object back down to the ground.
If you want to delve deeper into Newton’s Laws, check out the information here
You can talk about stored energy or potential elastic energy as you pull back on the Popsicle stick, bending it. When you release the stick all that potential energy is released into energy in motion producing the projectile motion.
A catapult is a simple machine that has been around for ages. Have your kids dig up a little history and research when the first catapults were invented and used! Hint; check out the 17th century!
Thursday May 14, 2020 – Make an Astronaut Lander
Courtesy of https://www.jpl.nasa.gov
Landing on the Moon and Mars is tricky. A lander headed to the Moon can go as fast as 24,816 miles (39,937 kilometers) per hour. Those on their way to Mars might go up to 13,000 miles (21,000 kilometers) per hour. To land gently, these spacecraft need to slow down before touching the surface! And if there are astronauts on board, the lander needs to keep them safe, too.
In this challenge, use what you know and what you can investigate about gravity, motion, forces and a target of your choosing (the Moon, Mars or beyond!) to design and build a lander that will protect two “astronauts” when they touch down. Just as engineers had to develop solutions for landing different kinds of vehicles on the Moon and Mars, you will follow the engineering design process to design and build a shock-absorbing system out of simple materials; and improve your design based on the results of your test landings.
Watch the Tutorial
See below for materials and step-by-step instructions. For more video tutorials and activities like this one, visit Learning Space.

Materials
- Scissors
- 1 piece of stiff paper or cardboard, approximately 4 x 5 in (10 x 13 cm)
- 1 8 oz – 12 oz paper or plastic cup
- 3 index cards – 3 x 5 in (8 x 13 cm)
- 2 regular marshmallows (representing 2 astronauts)
- 10 miniature marshmallows
- 3 rubber bands
- 8 plastic straws
- Tape, 1 meter
Don’t worry if you don’t have all of t he materials. Get creative and substitute materials with what you have! It’s all part of the process!

1. Brainstorm
Consider how you will softly land your “astronauts” using the allowable materials.
- What kind of shock absorber can you make from these materials to help soften a landing?
- How will you make sure the lander doesn’t roll while falling through the air or tip over when it lands?
Image caption: In this composite image from 1969, astronaut Buzz Aldrin can be seen coming down a ladder from the mission’s command module (or lander). Shortly after this series of images was taken, Buzz Aldrin became the second person to walk on the Moon. Image credit: NASA | › See more images from the Apollo 11 mission

2. Design a shock-absorbing system
Think about springs and cushions. The two regular marshmallows (your astronauts) must be inside the cup. Sketch your design. Note: The cup has to stay open – no lids!

3. Build the lander
Using your design as a guide, assemble your lander.

4. Test, evaluate and redesign
Drop your lander from a height of one foot (30 cm). If the “astronauts” bounce out or the lander tips over, figure out ways to improve your design. Study any problems and redesign. Then test again to see if your new design solved the problem.

5. Take it higher
Drop your lander from progressively higher heights (two feet, three feet, etc.). As problems arise, study them and redesign. Then, test again.
Image caption: In this image from 1969, the Apollo 11 lunar module can be seen flying above the Moon after astronauts performed the first moonwalk. Earth is visible above the horizon of the Moon. Image credit: NASA | › See more images from the Apollo 11 mission

Share it!
Share your design with NASA! Snap a picture or video of your spacecraft and post it on Facebook, Twitter and Instagram using the hashtag #VirtualMoonshot. Be sure to get your parents’ or guardians’ permission before sharing your snaps online – or ask if they can post it for you.
Monday May 11, 2020 – Make a Paper Mars Helicopter
Courtesy of https://www.jpl.nasa.gov
NASA’s Perseverance Mars rover, launching in July 2020, will carry the first helicopter to the surface of Mars! This helicopter has to be super lightweight to fly on Mars. It also needs large blades that can rotate really fast so it can generate enough lift to overcome the gravity of the Red Planet and lift off the ground.
In this project, you will build a paper helicopter. Then, just as NASA engineers had to try out different versions of the Mars helicopter before coming up with a final design, you will experiment with the design of your helicopter to see what works best.
Watch the Tutorial
See below for materials and step-by-step instructions. For more video tutorials and activities like this one, visit Learning Space.
Make a Paper Mars Helicopter
NASA’s Perseverance Mars rover, launching in July 2020, will carry the first helicopter to the surface of Mars! This helicopter has to be super lightweight to fly on Mars. It also needs large blades that can rotate really fast so it can generate enough lift to overcome the gravity of the Red Planet and lift off the ground.
In this project, you will build a paper helicopter. Then, just as NASA engineers had to try out different versions of the Mars helicopter before coming up with a final design, you will experiment with the design of your helicopter to see what works best.
Watch the Tutorial
See below for materials and step-by-step instructions. For more video tutorials and activities like this one, visit Learning Space.
In this episode of Learning Space, you’ll learn how to build a paper helicopter, then see if you can improve the design like NASA engineers did when making the first helicopter for Mars. | Watch on YouTube

Materials
- Plain paper OR a copy of the template – Download PDF
- Scissors
- Measuring Tape
- Pencil
- (Optional) 3-meter (10-foot) length of lightweight ribbon OR smartphone camera

1. Cut out the helicopter
Cut along the dashed lines of the template. If you’re using plain paper, make a sketch of the helicopter solid and dashed lines as a guide.

2. Fold along the solid lines
The propeller blades, A and B, should be folded in opposite directions along the solid lines. The X and Y panels fold toward the center, and Z is folded upward to give the body of the helicopter rigidity and lower its center of gravity for more stable flight.

3. Do a test flight
Stand up and hold the helicopter by its body. Raise it as high in the air as you can. Now, drop it. What do you observe? Which way do the blades turn? Drop the helicopter from a higher spot. (Climb a few stairs or stand on a step stool.) How does the performance change?

4. Compare
Grab an unfolded piece of paper the same size as the one used to make the helicopter. Drop it at the same time as the helicopter. Which falls faster? Wad up the piece of paper into a ball. Drop this paper ball at the same time as the helicopter. Which falls faster? Can you guess why? Hint: It has something to do with air resistance.
5. Experiment
Make one change to your helicopter. Try folding the bottom up one more fold, or shortening or changing the shape of the blades. How does the performance of your helicopter change? Why? Can you figure out a way to make your helicopter blades turn faster or slower?

6. Make a new model
To make the Mars helicopter, NASA engineers had to build and test multiple designs to find something that could get enough lift from the Red Planet’s thin atmosphere.
Lift is a force that is generated when the slightly angled moving blades of the helicopter encounter air particles. This increases the air pressure on the bottom of the blades. And the increased air pressure forces the blades and the entire helicopter up into the air. When there are fewer air particles in the atmosphere, less lift is generated. Mars’ atmosphere has only 1% of the particles of Earth’s atmosphere. This means that blades that generate enough lift on Earth won’t work on Mars.
To generate enough lift for the Mars helicopter, engineers gave it two sets of enormous blades that are 4 feet (1.2 meters) across and rotate about 10 times as fast as those of helicopters on Earth.
Think about how you want to improve the performance of your helicopter and make another one that is different from your first. Use a different kind of paper or make a much smaller or much larger one. How big of a helicopter can you make that will still work? How small of a helicopter can you make? How do helicopters with different blade sizes compare in performance? What size works best? How do you define “best performance”?
7. Reverse it
Notice which way your helicopter blades turn. Is it clockwise or counterclockwise? Is this consistent for all of your helicopters? What is a single change you can make to your helicopters to make them spin in the opposite direction?

8. Count the rotations
Measure the height of your shoulder and write this down. Choose your best-performing helicopter and drop it from shoulder height. Count the number of rotations it makes before landing. If counting the rotations is difficult because of the speed, either record a video of the drop and play it back in slow motion or attach a straightened ribbon to the bottom of the helicopter body. You can count the twists in the ribbon after it lands. Record this number next to the drop height.
9. Repeat
What would happen if you dropped the helicopter from a lower height? Repeat the measuring, dropping and counting from a lower height.
10. Predict
How many times would the helicopter rotate if you dropped it from a taller height? Measure a taller height, and then predict the number of rotations your helicopter will make.
11. Test your prediction
Drop your helicopter from the taller height and see how close your prediction was. Try again from other heights and see if you can make better predictions each time!
Thursday May 7, 2020 – Measuring the Supermoon
Courtesy of https://www.jpl.nasa.gov
Overview
Students compare month-to-month analog or digital measurements collected during multiple full moons.
Materials
- Ruler, meterstick or yardstick
- Paper
- Clipboard or letter-size sheet of cardboard
- Pencil
- Mobile device with camera app
- Measuring the Moon (Digital) Student Worksheet – Download PDF
- Measuring the Moon (Analog) Student Worksheet – Download PDF
- Calculating the Brightness of the Moon Student Worksheet – Download PDF
Management
- Data is collected by students over the course of multiple months and compared. It may be necessary to collect and hold student data (either physically or digitally) so that it is not lost during the course of this lesson.
- Because the Moon measurements need to be taken at night and away from school, students will encounter various conditions. Having students work in groups to collect and analyze data will enable students who were unable to collect all the data to still actively participate.
- Model how to conduct the Moon measurement steps to provide an example of what students should do when they take measurements at home.
Background
As the Moon orbits Earth, it goes through phases, which are determined by its position relative to Earth and the Sun. When the Moon lines up on the opposite side of Earth from the Sun, we see a full moon. The new moon phase occurs when the Moon and the Sun are lined up on the same side of Earth.
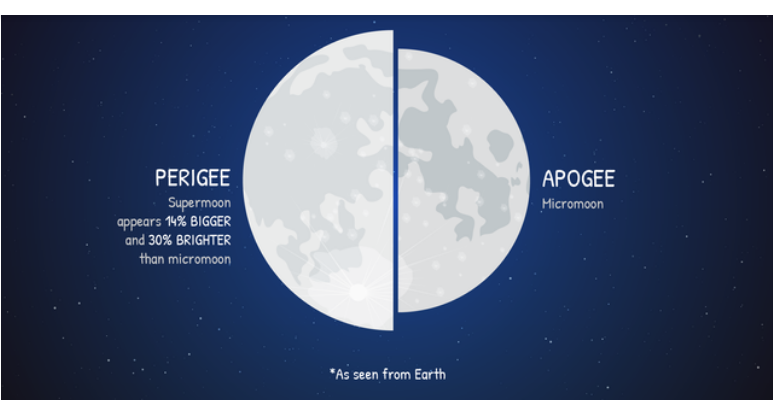
The Moon doesn’t orbit in a perfect circle. Instead, it travels in an ellipse that brings the Moon closer to and farther from Earth in its orbit. The farthest point in this ellipse is called the apogee and is about 405,500 kilometers from Earth on average. Its closest point is the perigee, which is an average distance of about 363,300 kilometers from Earth. During every 27-day orbit around Earth, the Moon reaches both its apogee and perigee.
Full moons can occur at any point along the Moon’s elliptical path, but when a full moon occurs at or near the perigee, it looks slightly larger and brighter than a typical full moon. That’s what the term “supermoon” refers to.
What makes a supermoon super? Watch this short animation to find out. Credit: NASA/JPL-Caltech
Because supermoon is not an official astronomical term, there is no definition about just how close to perigee the full moon has to be in order to be called “super.” Generally, supermoon is used to refer to a full moon 90 percent or closer to perigee. (When the term supermoon was originally coined, it was also used to describe a new moon in the same position, but since the new moon isn’t easily visible from Earth, it’s rarely used in that context anymore.)
A more accurate and scientific term is “perigee syzygy.” Syzygy is the alignment of three celestial bodies, in this case the Sun, Moon and Earth. But that doesn’t quite roll off the tongue as easily as supermoon.
Procedures
Depending on what is appropriate for your students based on available technology and comfort level, there are two methods for measuring the Moon: digitally using a mobile device or with paper and pencil.
Additionally, students familiar with exponents and solving for variables can calculate the brightness of the supermoon compared to a full moon at apogee.
Click on the links below to jump to procedures for:
- Measuring the Size of the Moon – Digital
- Measuring the Size of the Moon – Analog
- Calculating the Brightness of the Moon
Measuring the Size of the Moon – Digital
Students complete the following procedures using the student data sheet.
- Make note of where the full Moon is in the sky. Students can use stationary objects (buildings, trees, power poles, etc.) to find its relative location or measure the Moon’s location using altitude (vertical position) and azimuth (horizontal position).
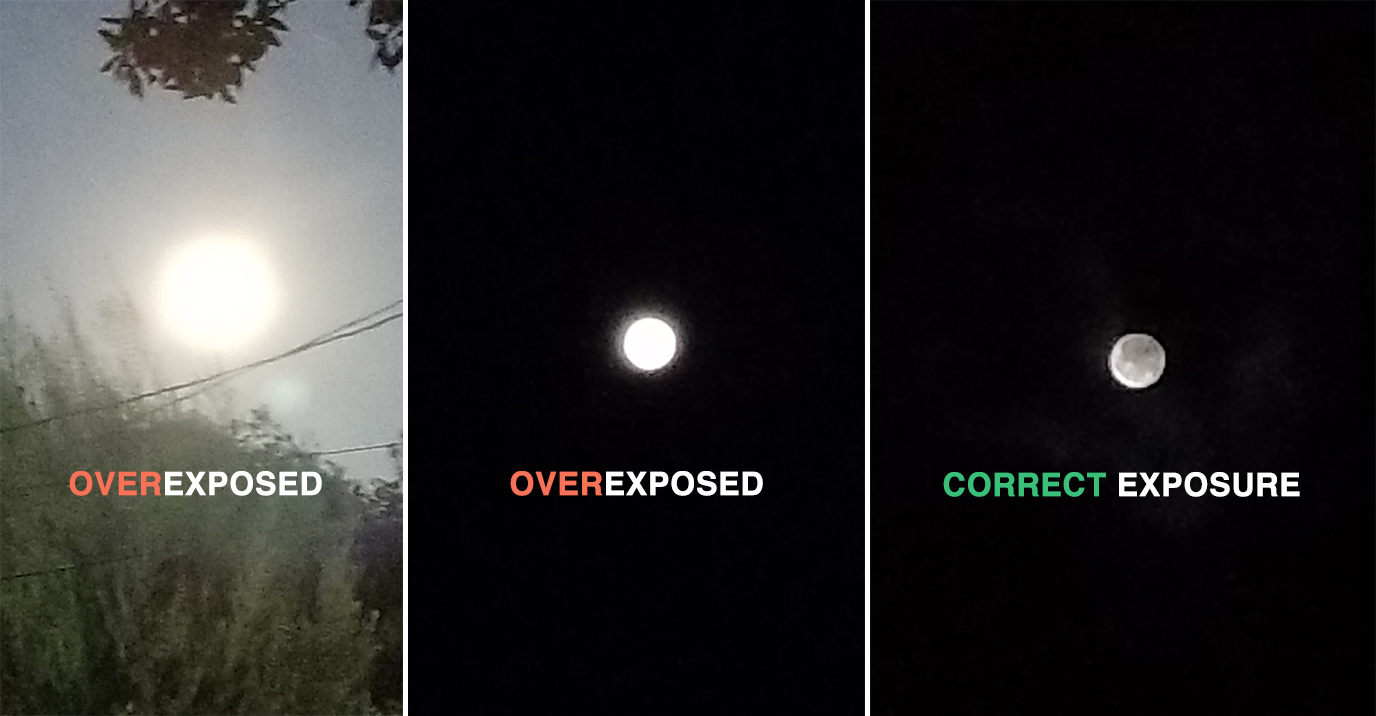
- Launch the mobile device’s camera app. Using the camera’s exposure control, reduce the exposure so the Moon doesn’t appear overexposed. It should appear dim, perhaps with grey areas (the Moon’s mare), not bright white. An overexposed Moon image will make finding the edge and measuring its size impossible.
3. Students can use the camera to zoom in on the Moon, but they must be sure they record the zoom factor (e.g., 2.0x, 3.4x). If the camera does not display zoom factor, they should zoom in all the way. Do not zoom part way if the camera does not display zoom factor as students may not be able to find the exact zoom position for future measurements.
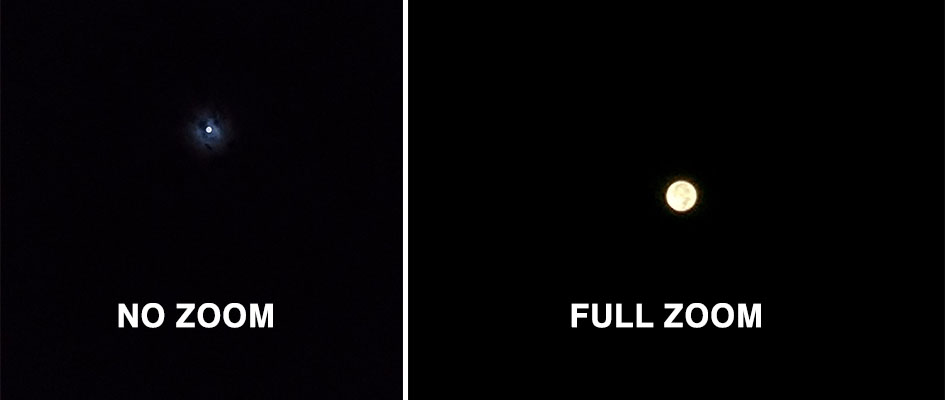
4. Take a picture of the Moon. Consider propping the device on something to hold it steady and capture a sharper image. Students might want to take several pictures and work with the best one.
5. Measure the number of pixels across the disk of the Moon. There are several options:
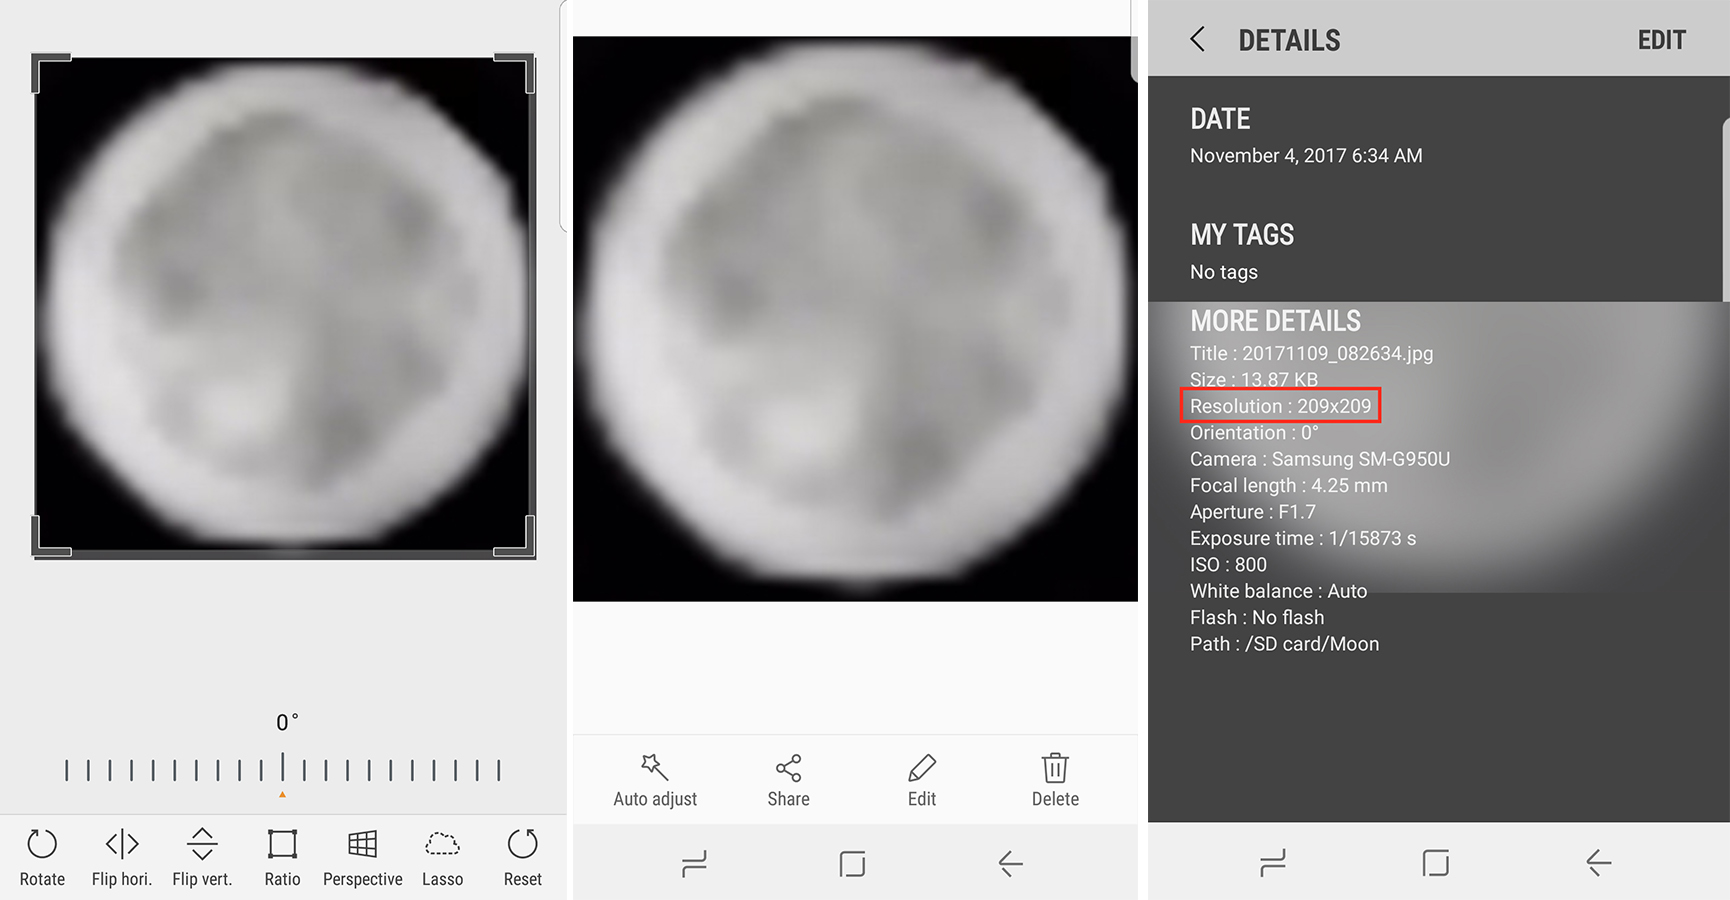
i. Crop the image to the size of the Moon and find the size of the image within the mobile device: Locking the aspect ratio at 1:1 will constrain students to a square, helping to accurately crop the Moon’s dimensions. Within Android mobile devices, looking at photo details or info will give students pixel dimensions of an image. If the image is cropped to the size of the Moon, the image size is also the pixel measurement across the Moon. Students using iOS devices may need to download a third-party app such as Photo Investigator or Picture Information Extractor to view the pixel dimensions of the image. (See Figure 1.)
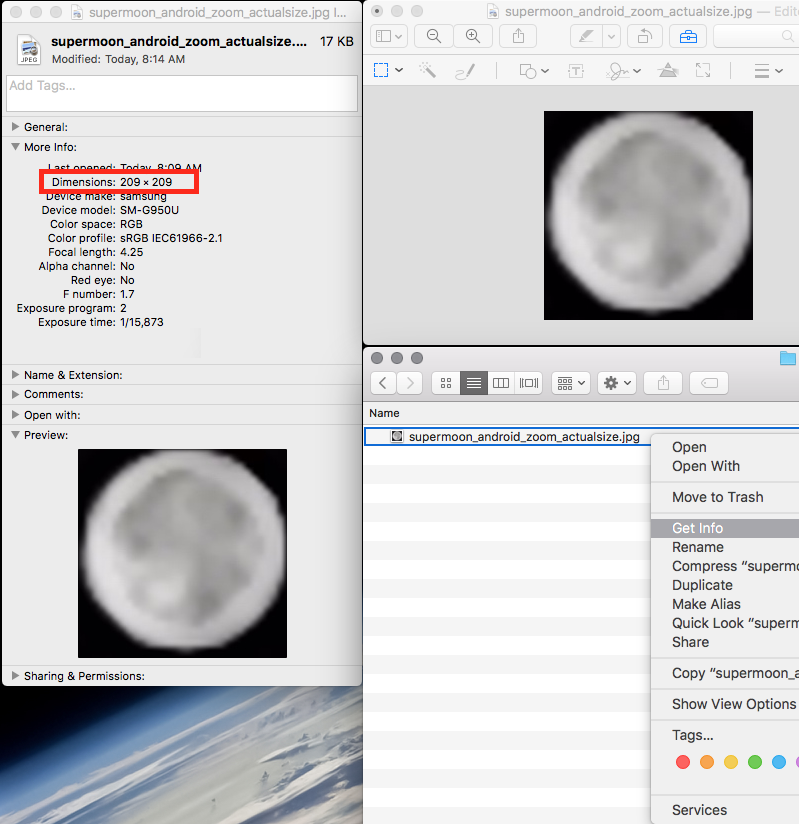
ii. Crop the image to the size of the Moon within the mobile device, then transfer the image to a computer: Again, locking the aspect ratio at 1:1 will constrain students to a square, helping to accurately crop the Moon’s dimensions. Right-click on the file and select Properties (Windows) or Get Info (Mac) to view pixel dimensions. (See Figure 2.)
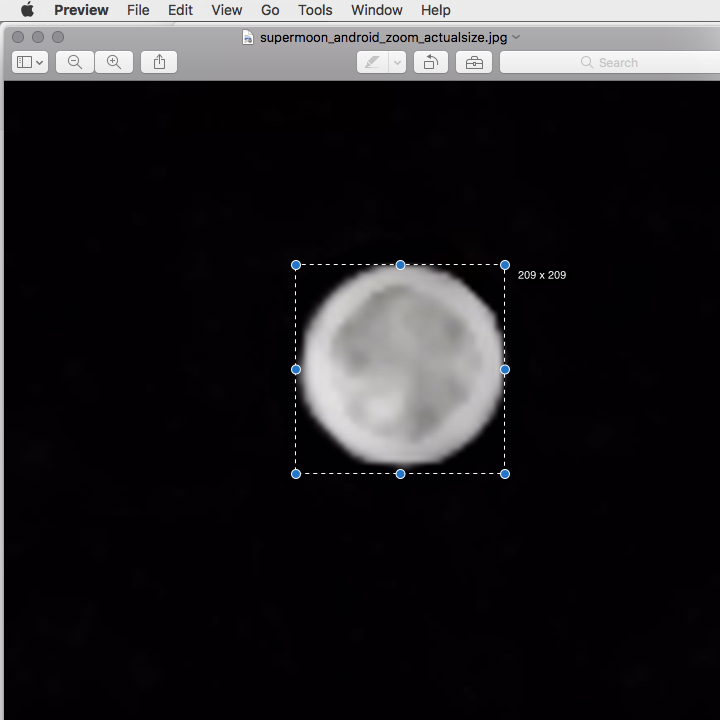
iii. Transfer the image to a computer and use an on-screen pixel ruler such as PixelRuler or PicPick for Windows, or Preview in MacOS to click and drag a pixel readout over the image. In both cases, students should make note of how much the image is zoomed (e.g., actual size, 150%, 200%, etc.) and use that same setting each time they measure the pixel dimensions of the Moon. (See Figure 3.)
iv. Students repeat this procedure during multiple successive full moons, while the Moon is in the same approximate spot in the sky (recorded in Step 1).
v. Compare measurements from month to month using the questions on the student data sheet:
- What is the largest pixel dimension measured?
- What is the smallest pixel dimension measured
- What is the ratio between the largest pixel measurement and the smallest pixel measurement
- What percentage change is there between the smallest pixel measurement and the largest pixel measurement?
Measuring the Size of the Moon – Analog
- Make note of where the full Moon is in the sky. Students can use stationary objects (buildings, trees, power poles, etc.) to find its relative location, or measure the Moon’s location using altitude (vertical position) and azimuth (horizontal position).
- Line up the edge of the paper with the edge of the clipboard or cardboard and clip or tape the paper down securely.
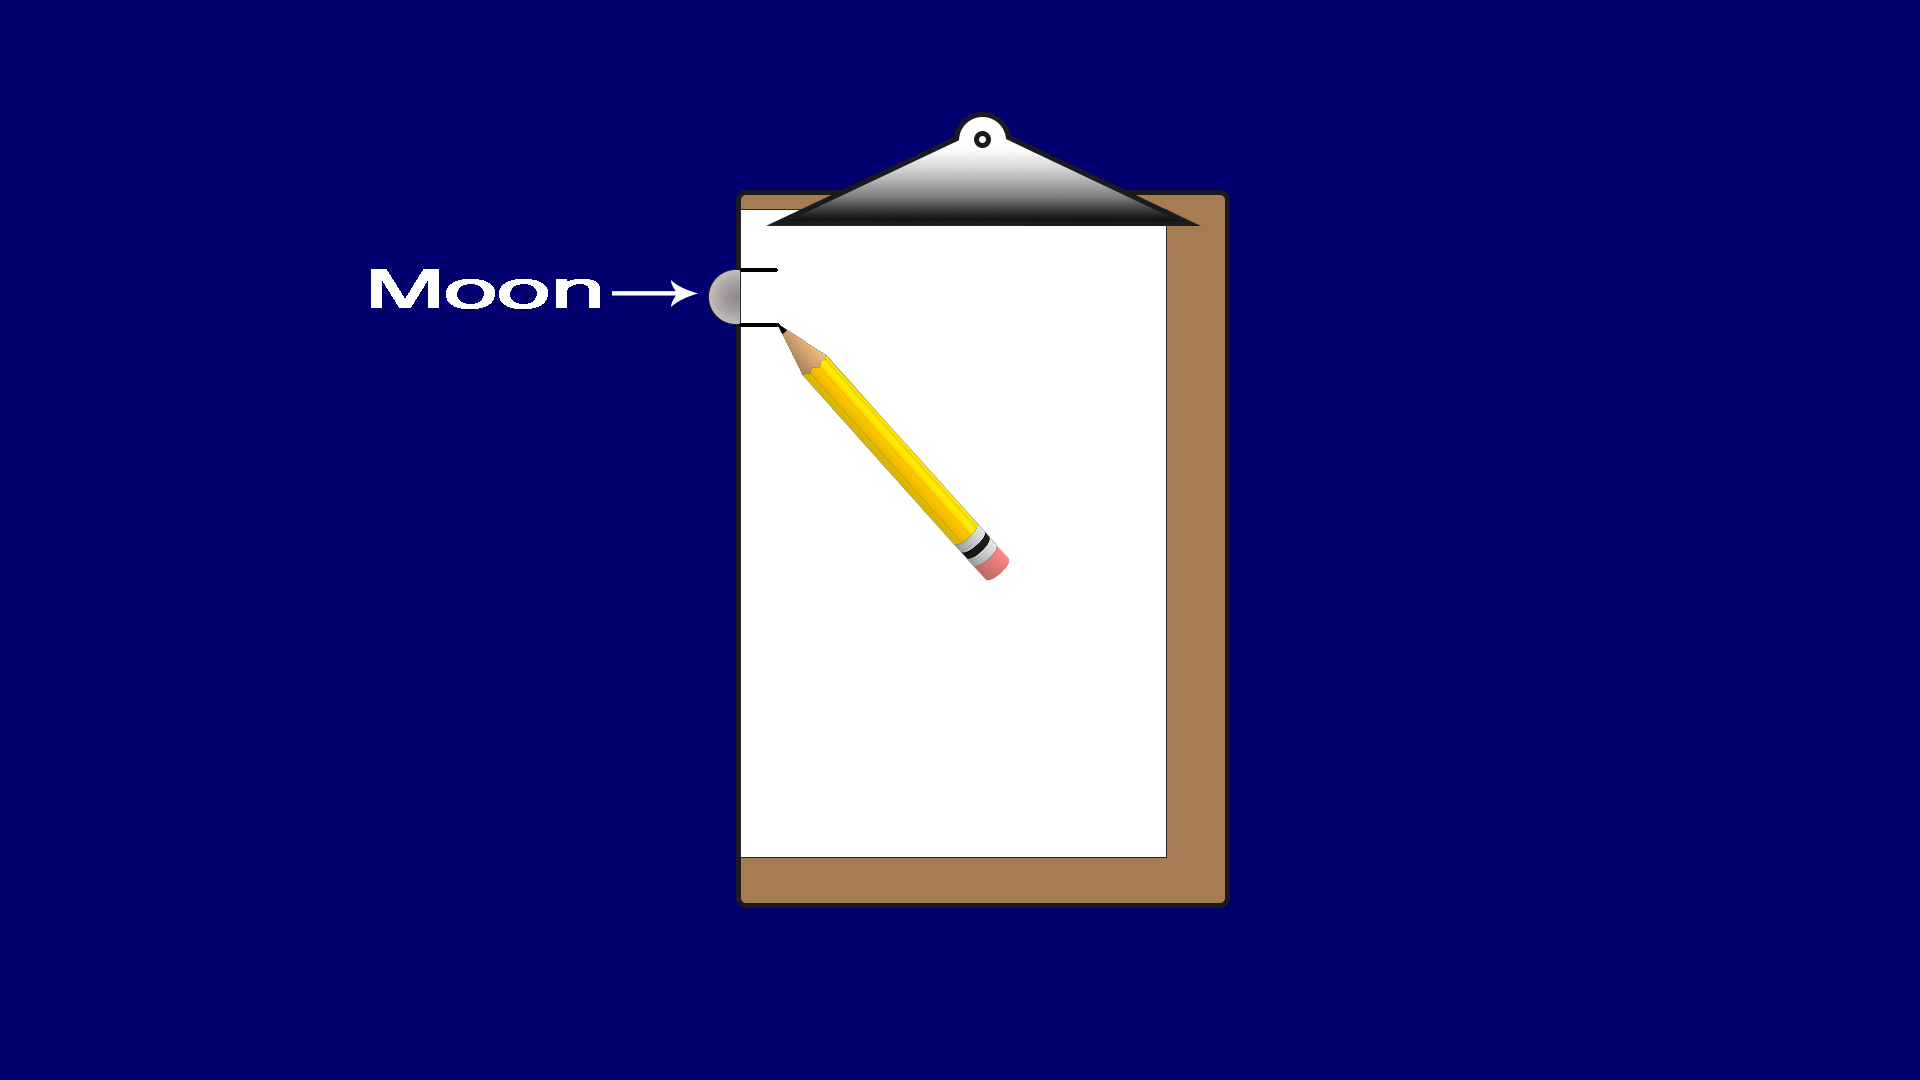
- With the paper secured, students should place or hold the paper a measured distance (one to two feet) from their face so that they can see the Moon and the paper. Make note of this distance. It will be important to use this same distance for each Moon measurement.
- Line up the edge of the paper with the Moon.
- Draw lines on the paper that match where the top and bottom of the Moon intersect the paper. Measure the distance between the lines in millimeters and write it down.
6. Students repeat this procedure during multiple successive full moons, while the Moon is in the same approximate spot in the sky (recorded in Step 1), placing the paper the same distance from their face each time.
7. Compare measurements from month to month using questions on the student data sheet:
- What is the largest diameter measured?
- What is the smallest diameter measured
- What is the ratio between the largest diameter measured and the smallest diameter measured
- What percentage increase is there between the smallest diameter measured and the largest diameter measured?
Calculating the Relative Brightness of the Moon
The light from a full moon is bright enough to cast shadows, but it is still very dim. In fact, it’s so dim that a mobile device’s light sensor combined with a basic lux measurement app won’t register a reading. Direct sunlight is about 1 million times brighter!
Instead, students can compare the light intensity (I1) of a full moon at apogee (D1) to the light intensity (I2)of a full supermoon at perigee (D2).
Then, given that the brightness, or intensity, of the Moon is inversely proportional to the square of the distance from the moon to Earth, have students find how much brighter a full supermoon is than a full moon at apogee. Have them visit https://www.fourmilab.ch/earthview/pacalc.html to find the farthest apogee and closest perigee for any year they wish.
Discussion
- The supermoon can appear up to 14% larger in diameter than a full moon at apogee. Did the comparisons between Moon measurements show a size difference of 14%? If not, why?
The comparisons may not have been made between the supermoon (closest to Earth and largest apparent diameter) and a full moon at apogee (farthest from Earth and smallest apparent diameter).
If pencil and paper were used to measure the Moon’s apparent diameter, holding the paper closer or farther away during successive measurements could account for a difference in apparent diameters.
In a digital image, an overexposed Moon appears larger than it actually is, which would affect results.
This is a great opportunity to discuss the importance of and difficulty in obtaining accurate measurements.
- When calculating differences in brightness using different years, are the calculated increases in brightness the same? Why or why not?
Different maximum apogee and minimum perigee distances will result in different calculations from year to year (e.g., 1.299 for 2018 compared with 1.295 for 2017), but students should find that the brightness intensity of a supermoon is approximately 30% brighter than the brightness intensity of a full moon at apogee (ratio of 1.3).
- How did your experience observing the supermoon compare with what was implied by what you saw in the news or online as well as images you might have seen leading up to the supermoon?
Answers will vary
Assessment
- Students should find that the intensity of the full supermoon is approximately 30% (1.3 times) higher than the intensity of a full Moon at apogee.
- Comparing measurements of the Moon’s diameter as observed during a full moon versus a supermoon should show a difference in diameter of up to 14%. This will vary depending on when students measure the Moon and how accurate their measurements are.
Extensions
- NASA’s Moon Website
- Modeling the Earth-Moon System – Using an assortment of playground and toy balls, students will measure diameter, calculate distance and scale, and build a model of the Earth-Moon system.
- Moon Phases – Students learn about the phases of the Moon by acting them out. In 30 minutes, they will act out one complete Moon cycle.
- Whip Up a Moon-Like Crater – Whip up a Moon-like crater with baking ingredients as a demonstration for students.
Tuesday May 5, 2020 – Why Is The Sky Blue?
Courtesy of https://www.rookieparenting.com
On a clear day, you can see that the color of the sky is blue even though sun light does not seem to contain any color. So why is the sky blue if sunlight is colorless?

Refraction Of Light
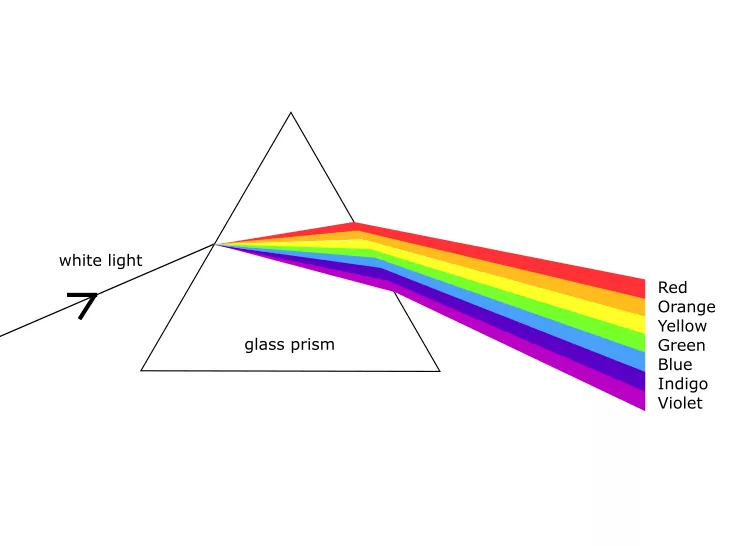
The “colorless” light from the sun is actually white light. It is made up of all the rainbow colors – red, orange, yellow, green, blue, indigo, violet – mixed together.
Light bends when it passes from one medium (e.g. air) into another medium of a different density (e.g. water). This bending of light is called refraction.

Different colors are refracted by different angles because they have different wavelengths. As a result, when white light is refracted, it is separated into different colors, known as dispersion of light.
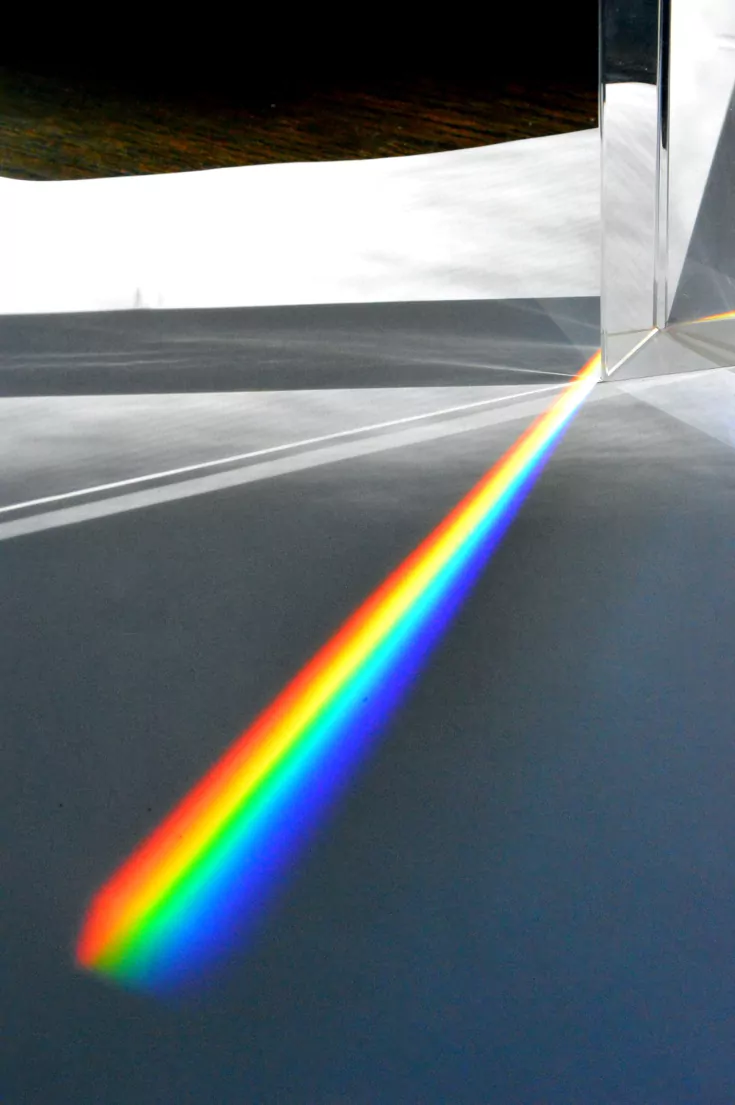
A rainbow is an excellent demonstration of the dispersion of light. After or during rainfall, you can see a rainbow if the sunlight hits the water droplets in the air at the right angle.

Another way to see the spectrum of colors that comprise the white light is by placing a glass prism under strong sunlight.
Rayleigh Scattering
In the air, there are many tiny air molecules. These molecules are very small, so small that we can’t normally see them with our bare eyes even though the air is full of them, billions and trillions.
On a clear day, sunlight passing through the atmosphere is scattered by air molecules. This scattering effect is called Rayleigh Scattering.

Scattering is stronger with shorter wavelengths. Among visible colors, the blue-violet end of the color spectrum has the shortest wavelengths. So the blue-violet colors are scattered more than the red-orange colors.
Although violet is scattered more than blue because its wavelength is shorter, our eyes are more sensitive to blue than to violet. This is why the sky is blue during the day.
To summarize, the sky is blue because the blue color inside the sunlight is scattered more by air molecules and is perceived better by our eyes.

Why Is The Sky Blue Experiment For Kids
Active Time: 10 minutes Total Time: 10 minutes
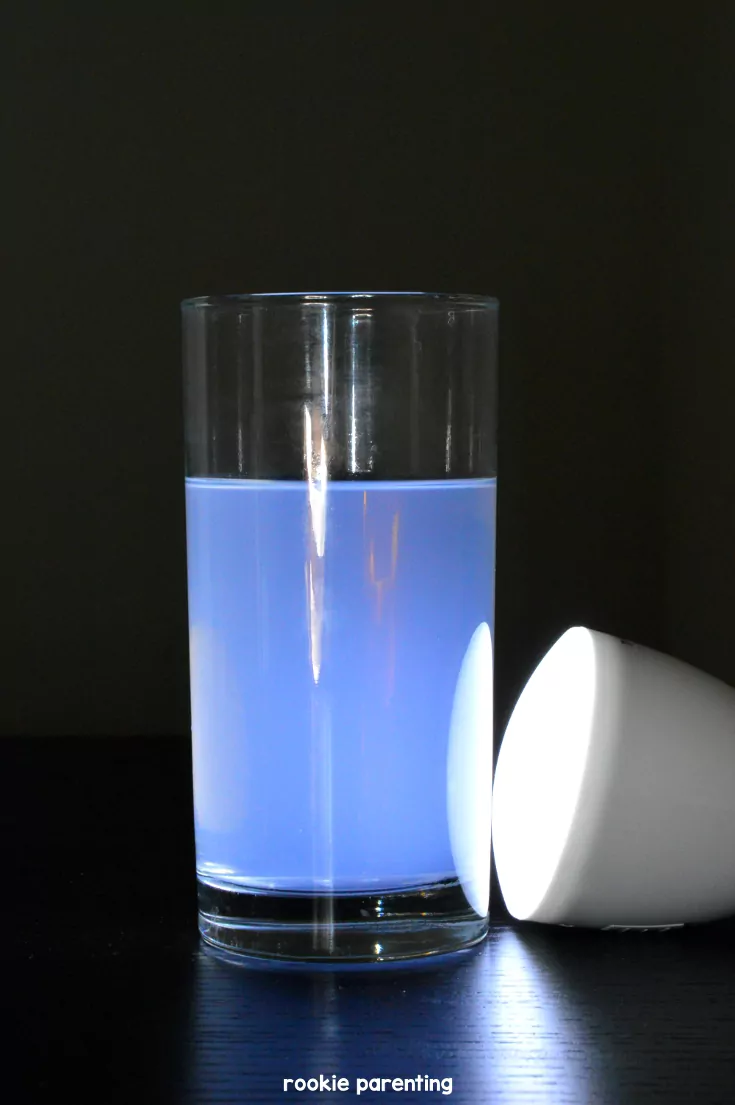
Here is a science experiment that simulates how sunlight passing through the atmosphere can turn the sky blue. We will use a flash light to turn a glass of white colloid into blue.
Materials
- water
- soap (preferably white, I used Kirk’s Castile soap. A little bit of milk or milk powder should also work)
Tools
- a clear glass
- flashlight that emits white light (I used TaoTronics LED light bulb)
- adult supervision
Instructions
- Fill the glass with water.
- Dissolve a little bit of soap in the water to get a cloudy solution. If you use a bar soap like I do, submerge it into the water and rub the surface a little bit to get a white solution. This solution will be the blue sky for your experiment. If you use milk powder, dissolve one teaspoon at a time until you have a white cloudy solution.
- In a dark room, point the flashlight at the cloudy solution from the side.
- Observe the fluid from the side to see a hint of the sky blue color.
Notes
The reason why the white suspension turns blue is similar to the reason why the sky is blue (although not exactly the same reason). The sky is blue because of Rayleigh Scattering. The white fluid turns blue because of Tyndall Scattering, an effect closely related to Rayleigh Scattering.
Tyndall Scattering, named after renown Irish physicist, John Tyndall, is the phenomena of scattering of light by small particles in a colloid or a very fine suspension. Similar to Rayleigh scattering, the intensity of the scattered light depends on the wavelength of the light. The shorter the wavelength, the stronger the scattering.
Like sunlight, the white light from a flash light is also made up of all the rainbow colors. Therefore, blue light, which has a shorter wavelength than most other rainbow colors, is scattered more and the suspension appears blue.
Monday May 4, 2020 – Sunspot Cycles
Courtesy of Science Buddies Staff. (2020, April 1). Sunspot Cycles. Retrieved from https://www.sciencebuddies.org/science-fair-projects/project-ideas/Astro_p017/astronomy/sunspot-cycles
Sunspot activity has been monitored continuously since about 1700. The historical data shows that sunspot activity rises and falls in a roughly 11-year cycle. This project shows you how you can use both graphical and statistical analysis to look for patterns in cyclical data.
Objective
Do sunspot cycles consistently have a faster rise time and a slower decay time? The goal of this project is to find out, using historical data and basic statistical analysis. As an added bonus, you’ll learn the basics of working with a spreadsheet program.
Introduction
Sunspots were first discovered by Galileo Galilei in 1612. Galileo made regular observations of sunspots and was able to prove that he was seeing features on the surface of the sun, which moved as the sun rotated. (Another interesting project involving sunspots is to recreate Galileo’s experiments using satellite imagery that you can collect online. See Using the Solar & Heliospheric Observatory Satellite (SOHO) to Determine the Rotation of the Sun.)

What is a sunspot, anyway? The SOHO Explore Glossary defines a sunspot this way: “a temporary disturbed area in the solar photosphere that appears dark because it is cooler than the surrounding areas. Sunspots consist of concentrations of strong magnetic flux. They usually occur in pairs or groups of opposite polarity that move in unison across the face of the Sun as it rotates.” (SOHO Explore Glossary, 2006)
To see what sunspots looks like, here are two images of the sun’s photosphere, taken by the Solar and Heliospheric Observatory (a joint project of NASA and the European Space Agency). The one on the left was taken on November 15, 1999. The one on the right was taken on February 20, 2006.
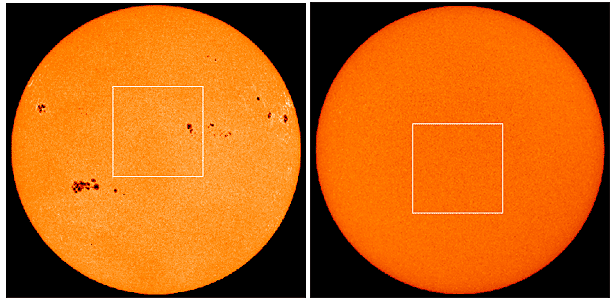
For more solar images, check out the SOHO links in the Bibliography. The EIT (Extreme ultraviolet Imaging Telescope) images show the sun’s atmosphere for specific wavelengths in the ultraviolet region of the spectrum. For example, at 171 angstroms (one angstrom is one ten-billionth of a meter, or 10-10 m) the UV light is mostly emitted by Fe IX and X (iron ionized 8 or 9 times) at 1 million degrees Kelvin. Iron emissions provide visualization of the magnetic field lines. Here are two examples of these amazing images, corresponding to the same dates as the visible-light images:

We’ve come a long way from Galileo’s telescope in 1612! But as you’ll see, there is still value in data from hundreds of years ago. We have annual data on sunspot numbers going back to 1700, and monthly data to 1749. The sunspot number for an observation is equal to the number of individual sunspots observed plus ten times the number of groups of sunspots observed. The reason for doing this is that viewing conditions are not always ideal, and an average group has about ten sunspots. This way, the data is reliable even when small spots are hard to visualize. The monthly sunspot number is the average of all the daily numbers for the month. Here are two graphs of the monthly data.

The data is the same in both graphs; it is just shown with two different vertical scales. It is obvious from both graphs that sunspot activity is cyclical, with the numbers regularly rising and falling. The tick marks on the horizontal axis are at 11-year intervals, the approximate length of the solar cycle. For example, if you compare the tick marks over the period from 1838 to 1893, you see that they fall at about the peak of each of those cycles.
The reason for showing two graphs is to show you that sometimes you can discover something new in your data just by looking at it differently. The top graph is how the data would appear with typical default settings of a graphing program. Typical default settings will produce a graph with an aspect ratio (horizontal length divided by vertical length) of about 1.6, and a y-axis scale chosen so that the data fills the graph region. These settings produce a reasonable-looking graph, and the cyclical nature of sunspot activity is readily apparent.
Compare the two graphs carefully, though, and see if the lower graph shows you anything more. The lower graph is made following an idea from William Cleveland. He used a computer algorithm to select an aspect ratio so that selected line segments in the data would have a slope of ±45° (Cleveland, 1994, cited in Tufte, 1997). In the upper graph, the sunspot cycles all rise and fall steeply. This makes it difficult for your eye to notice any subtle patterns in the cycles. Cleveland’s idea is to select an aspect ratio so that the rising and falling slopes are closer to a ±45° angle, on average. Showing the data this way makes it much easier for your eye to see subtle patterns in the cycles. For example, compare the onset of each cycle to the decay. The onset time is the time from the beginning of the cycle to the maximum of the cycle. The decay time is the time from the maximum of the cycle to the end of the cycle. Are they about equal, or is one longer than the other? Which has a steeper slope? This comparison is much easier to make in the lower graph than in the upper one.
For some of the cycles, the onset time and decay time look fairly similar. For others, it appears that the onset time is shorter than the decay time. Is there a way to measure how strong the effect is? By answering these kinds of questions, we can get a better understanding of the solar physics underlying sunspots.
In this project, you will learn how to use basic statistical analysis of the historical data to test the hypothesis that sunspot cycles consistently have a faster rise time and a slower decay time. As an added bonus, you’ll learn the basics of working with a spreadsheet program.
Terms and Concepts
To do this project, you should do research that enables you to understand the following statistical terms and concepts:
- sunspots,
- parts of the sun:
- core,
- radiative zone,
- convective zone,
- chromosphere,
- photosphere,
- corona;
- sunspot cycle,
- statistical terms:
- population,
- sample,
- mean,
- standard deviation,
- variance,
- null hypothesis,
- t-test,
- statistical significance.
Materials and Equipment
To do this experiment you will need the following materials and equipment:
- Computer with Internet access and a spreadsheet program.
Experimental Procedure
- Do your background research so that you are knowledgeable about the terms and concepts.
- If you are not familiar with using a spreadsheet program, be sure to take the time to go through the Excel tutorial listed in the Bibliography.
- Here is a short version of the data analysis steps you’ll be following in order to test the hypothesis that the sunspot cycle onset times are faster than the decay times. The links following each step will jump you to the detailed instructions for that step. You can use your browser’s “Back” button to return to these brief instructions.
- Import the historical data into Excel. (Downloading and Importing Data)
- Graph the data so that you can identify the approximate beginning and end of each cycle. (Graph the Data)
- From the spreadsheet data, identify the beginning, end, and maximum of each cycle. Make a table of these values. (Extracting the Cycle Data)
- Use the spreadsheet functions to calculate the onset time and decay time for each cycle. Also, calculate the difference between onset time and decay time for each cycle. (Calculating Onset Time and Decay Time)
- Compare the results. Is there a difference between onset time and decay time? Is the difference statistically significant? You will be using a “paired t-test” for this calculation. The t-test tells you how confident you can be that your results are not simply due to random chance. You can use the t-test calculator given in the Bibliography, or you can put the formula in your spreadsheet, if you know it. (Testing for Statistical Significance)
- If spreadsheets are something new for you, then the detailed explanations that follow should help. If you are already comfortable with using spreadsheets, then you should be in good shape on your own.
Downloading and Importing Data
Note: the spreadsheet details provided are based on Microsoft Excel 2003. For other versions of Excel, or other spreadsheets, you can use the instructions here as a guideline and consult the help function of your spreadsheet program for more specifics.
- Download a table of historical sunspot numbers from http://sidc.oma.be/. Click on the link for “Sunspot archive & graphics,” then select one of the ASCII data files. To download, you can right-click on the file link, and select “Save As…”. Save the file with a “.txt” extension. We recommend that you use either the “monthly and monthly smoothed sunspot number” or the “yearly sunspot number” file.
- The “Readme” file (available on the same page as the historical data) explains the format of the data files.
- Import the sunspot data into your spreadsheet program. Here’s how to do it in Excel:
- From the menu, select File/Open…. You’ll see a dialog:

- At the bottom of the File Open dialog, under “Files of type:” use the drop-down list to select “Text Files (*.prn, *.txt, *.csv)”.
- Navigate to the directory where you saved your sunspot file, select it, and click “Open.”
- Excel now takes you through the “Text Import Wizard,” a series of three dialogs. The first dialog looks like this (monthly sunspot data file shown):

- Make sure “Fixed width” file type is selected, then click “Next.”
- The second Text Import Wizard dialog is used to set the field widths. It looks like this:

- For the yearly sunspot data file, you can accept the defaults (skip down to step 3j).
- For the monthly sunspot data file, there is a fourth column of numbers, which starts at the seventh row. (This is the monthly smoothed sunspot number, which is a running average of the preceeding and following six months.) Use the arrow to scroll down to row seven, as shown:

- To import the fourth data column, click next to it as shown:

- Click “Next.” For the yearly sunspot data, click “Finish” and go on to the section “Graph the Data”.
- For the monthly sunspot data, scroll down to the last few rows of data in the fourth column, and you will see some asterisks (indicating that these averages were computed with provisional data). Make sure that the asterisks are in the fifth data column, as shown here:

- You can choose to skip import of the asterisk column if you want. Click “Finish” to import the monthly data.
- From the menu, select File/Open…. You’ll see a dialog:
Graph the Data
- Before you graph your data, insert a new row at the top of the spreadsheet and add labels to identify the data in each column. (If you don’t know how to do this, the Excel tutorial can you show you, or you can use the Help function in Excel.)
- Also, it is useful to know the range of values you’ll be graphing, so that you can select the appropriate scale for your graph. You can use the “min” and “max” functions to have the spreadsheet find these values for you. (Again, the Excel tutorial shows how to do this.)
- Use the Chart Wizard to create a graph of the data. You’ll use the graph to identify the approximate location for the beginning of each cycle.
- Select Insert/Chart… to open Excel’s Chart Wizard.
- Select the “Area” Chart type, and the top-left Chart sub-type as shown:

- Click “Next,” then select the “Series” tab in the “Source Data” dialog as shown:

- In this example, we’re going to be plotting two series of data: the monthly numbers, and then the smoothed monthly numbers. The dialog shows all of the information filled in for the first series.
- We gave it a name: “Monthly”.
- We provided the range of values to plot on the y-axis (the monthly sunspot numbers from column “C”, rows 3–3087).
- We provided the range of labels for the x-axis (the year, from column “B”, rows 3–3087).
- When your first data series is all set up, click the “Add” button to add the next data series, like this:

- When your second data series is all set up, click the “Next” button for step 3, Chart Options. Add a title for the chart, and labels for the x- and y-axes:

- We think the chart looks cleaner without heavy gridlines, so turned them off using the Gridlines tab:

- Click “Next”, then select where you want the chart to appear (we’ve chosen to place it on a new worksheet), then click “Finish.”

- The graph created by the Chart Wizard is OK, but there are still some additional tweaks to make it better. For example, we can choose an interval for labeling the years on the x-axis that relates to the 11-year period of the solar cycle. We can change the scale of the y-axis to more closely match the range of the data. We can change the color of the data series, and show the smoothed data as a line over the solid monthly average.

- To make changes to the x-axis, double-click on the x-axis labels. You should see a “Format Axis” dialog:

- Change the “Major tick mark type” to “Outside”, as shown above. Then click on the “Scale” tab:

- We’d like our x-axis labels to relate to the 11-year period of the solar cycle. A reasonable choice is to have labels appear every 55 years, with tick marks in between at 11-year intervals. So we’ve changed the “Number of categories between tick-mark labels” to 660 (= 55 years × 12 months/year). We’ve changed “Number of categories between tick marks” to 132 (= 11 years × 12 months/year). When you’ve made these changes, click “OK.”
- To make changes to the y-axis, double-click on the y-axis labels. You should see a “Format Axis” dialog again. Set the “Major tick mark type” to “Outside”, as we did for the x-axis. Then select the “Scale” tab:

- Here we’ve set the minimum and maximum values are set closer to the actual range of the data (0–253.8, in our case). When you’ve made these changes, click “OK.”
- Finally, to change options for the appearance of the data (like color), double click on a data point. (If you “hover” the mouse over the graph, you should see a tooltip that tells you which data series you’re over.) Here we double-clicked on one of the “Smoothed” data points:

- We want the “Smoothed” data set to appear as a line, on top of the “Monthly” data set. So we selected “None” for the Area, and chose a “Custom” border, which we set to a brown color and a medium-thick line. For the “Monthly” data, we chose “None” for the border, and a black-filled Area. Here is how the finished graph looks:

- The colors are chosen to go well with one another and with the background. Jarring contrasts are avoided. We also don’t bother with effects like flashy gradient fills that have no relation to the data. Avoid meaningless clutter in your graphs. You should strive to present the data clearly, so it can speak for itself.
Extracting the Cycle Data
- Now that you have a graph of the data, you can use it to help identify the beginning and end of each solar cycle. In order to measure onset time and decay time accurately, we need complete solar cycles. Using the monthly data, there were 22 complete cycles between 1775 and 1996.
- You should construct a second table in your spreadsheet that shows the beginning, peak and end of each cycle. We can build this table by finding the row numbers for the beginning of each solar cycle in the data table.
- Use the graph to find the approximate dates for the beginning of each cycle (the lowest point in the “trough” between cycles). When the mouse “hovers” over a data point, a tooltip pops up with information about that point, as shown:

- Then, switch to the data table and scroll down to that approximate date (in this case, 1755.877). Scan the sunspot numbers around that date and find the smallest one. That’s the data row that you want. In the column at the right, write in the cycle number (starting with zero, as shown).

- Then copy the row number to your new data table, as shown:

- Next, you’ll use Excel’s “value” function to copy the data values for the beginning of the cycle.
- Enter the formula:

- Hit “Enter” and Excel copies the value for you:

- Then copy your formula:

- And paste it in to the next four columns:

- Excel fills in the remaining values for you:

- Enter the formula:
- Repeat steps 3–6 for each of the 22 cycles, leaving a blank row in your new data table (for filling in the maximum point of each cycle later). Remember to increase the cycle number by 1 each time.

- Now you’re ready to find the maximum for each cycle. Again, you can have Excel do some of the work for you. Using the row number information from your table, you’ll use the “max” formula to have Excel find the maximum sunspot number within each cycle.
- Column “C” is the monthly sunspot number, and the first cycle begins at row 79 and ends at row 212. Here’s the formula for the maximum monthly sunspot number for the first cycle:

- Click “Enter” and Excel finds the value for you:

- Column “C” is the monthly sunspot number, and the first cycle begins at row 79 and ends at row 212. Here’s the formula for the maximum monthly sunspot number for the first cycle:
- Now you need to find the date that corresponds to the maximum sunspot number for the cycle. You can use Excel’s “Find” feature for this.
- First click on column “C” (the monthly sunspot number) to select only this column for searching. Then select Edit/Find… (or use Ctrl+F) and fill in the maximum value that Excel just found for you (in this case, “107.2”):

- Click on “Find Next.” Excel finds the first occurrence of this value in column “C.” You can copy the date information:

- and then paste it in your data table:

- Note that the value you are searching for may occur more than once in the data table. If the date is too early, just click on “Find Next” again until you find the date for the right solar cycle.
- First click on column “C” (the monthly sunspot number) to select only this column for searching. Then select Edit/Find… (or use Ctrl+F) and fill in the maximum value that Excel just found for you (in this case, “107.2”):
- Repeat steps 8 and 9 for each of the 22 solar cycles.
Calculating Onset Time and Decay Time
- Now you have all the information you need to calculate the onset time and decay time for each solar cycle. With what you’ve learned about spreadsheets so far, you should be able to do this on your own.
- In addition, you should have Excel calculate the difference between the onset time and decay time for each solar cycle.
- Finally, for all three values (onset time, decay time and difference), calculate the average and standard deviation for all 22 solar cycles.
- Is there a difference?
Testing for Statistical Significance
- How can you tell if a trend in your data is real? Is there some way for you to know how reliable the data is? Yes: the answer is to apply the proper tests of statistical significance.
- Here is a quick summary of how such a test works:
- Formulate a “null hypothesis” (essentially the converse of what you want to prove). In this case, the null hypothesis would be that there is no difference between onset time and decay time.
- Select the appropriate statistical test for the data. In this case, the onset time and decay time are paired values, since each one is describing a different feature of the same solar cycle. The test to use in this case is “Student’s paired t-test.
- The result of the t-test will tell us, under certain assumptions, the probability that the null hypothesis is true. By convention, the probability is referred to as a “p value” and is given as an inequality. For example, if p < 0.01, this means that the probability of the null hypothesis is true is less than 0.01, or less than 1 in 100. Another way to put it is that we are 99% certain that our desired hypothesis (the converse of the null hypothesis) is, in fact, true.
- You can use this link: http://www.physics.csbsju.edu/stats/t-test.html to run a paired t-test on your data. Select the “paired t-test” choice. First you’ll have to enter the number of data pairs (22). Next you’ll get a page with a form where you can enter your pairs of onset and decay times for each solar cycle. When you’ve entered all the data, click on the “Calculate Now” button at the top of the page to get the results (which you can copy and paste for your lab notebook).
- Include the p value with your results on your display board. You should be prepared to explain what it means.
Variations
- In addition to testing the onset and decay times, test the rate of rise and decay (includes both time and magnitude). Is there a correlation between the magnitude of sunspot activity and the a difference in onset vs. decay rate?
Friday May 1, 2020 – Make Your Own Seismograph
Courtesy of https://www.spacebuddies.org
Introduction
Scientists study earthquakes so we can understand them better and hopefully one day predict them so we can save thousands of lives. A seismograph is a tool scientists use to record earthquakes and measure their strength. In this activity you will build your own seismograph using simple materials.
Credits
Ben Finio, PhD, Science Buddies
Materials
- Medium-sized cardboard box
- Paper or plastic cup
- String
- Marker
- Scissors
- Paper, or a very long printed receipt from a store
- Tape
- Coins, marbles, small rocks, or other small, heavy objects to use as weights
- Another person to help

Procedure
- Cut the lid or flaps off the cardboard box. Stand the box up on one of the smaller sides.
- Poke two holes opposite each other near the rim of the cup.
- Tie a piece of string, slightly longer than the length of the box, to each hole.
- Poke two holes in the top of the box, making sure they are the same distance apart as the holes in the cup.
- Push the two pieces of string through the holes and tie them together on the top of the box, so the cup hangs down inside the box. The bottom of the cup should be about an inch above the bottom of the box.

6. Poke a hole in the center of the bottom of the cup. Remove the cap from the marker, and push the marker through the hole, so its tip just barely touches the bottom of the box.
7. Fill the cup with coins or other small weights, making sure the marker stays vertical.

8. Fold a piece of paper in half lengthwise, then fold it in half lengthwise again. Unfold the paper and cut along the folds to form four equal-sized strips. Tape the strips of paper together end to end, to form one long strip. If you have a long printed receipt, you can skip this step.
9. Cut two slits on opposite sides of the cardboard box, as close as possible to the bottom edge. The slits should be wide enough to pass the paper strip through one side, across the middle of the box, and out the other side.
10. Make sure the marker is centered on the paper strip. You might need to poke different holes in the top of the box and re-hang the cup if necessary.

11. Now you are finally ready to use your seismograph! Stabilize the box with your hands as your helper slowly starts to pull the paper strip through the box from one side to the other side.
12. Now, shake the box back and forth (perpendicular to the paper strip, keeping the bottom of the box in contact with the table) as your helper continues to pull the paper strip through, doing their best to pull at a constant speed. How does the line on the paper strip change?
13. Pause your shaking for a few seconds (as your helper continues to pull the paper), then try shaking the box harder.
14. Pause for a few more seconds, then shake the box very gently.
15. Pull the paper strip all the way out of the box and look at the line.
Can you tell how hard the box was shaking based on the line? Can you tell when the box was not shaking at all?
What Happened?
When your helper pulls the paper through the box with no shaking, the marker should just draw a straight line on the paper. When you shake the box, it moves back and forth, and the paper moves along with it. Because of the heavy mass of the cup and the way it is suspended by strings, the cup does not move as much. This means that the paper moves back and forth under the (mostly) stationary marker, resulting in a squiggly line. The size of these squiggles (their amplitude) corresponds to how hard you shook the box, just like how the line drawn by a real seismograph corresponds to the strength of the earthquake. Read the Digging Deeper section to learn more about seismographs.
Digging Deeper
Earthquakes happen all the time, but most of them are so small that we can’t feel them, and they do not cause any damage. However, large earthquakes can be quite catastrophic—destroying buildings and causing significant damage to property and loss of life. An earthquake’s strength is measured on the Richter scale. The Richter scale goes from 1 to 10. Each increase of 1 on the Richter scale means the earthquake is actually 10 times more powerful (e.g. a 2.0 earthquake is 10 times stronger than a 1.0 earthquake, not twice as strong). As of 2019, the strongest earthquake ever recorded measured 9.5 on the Richter scale.
A seismograph is a machine used to measure the motion of the ground during an earthquake. Seismographs are very sensitive and can detect earthquakes that occurred very far away (along with other things that make the ground shake, like volcanic eruptions or large explosions) that might be too faint for humans to feel. Seismographs are made by hanging a heavy weight from a rigid frame connected to the ground. When the ground moves during an earthquake, the frame moves back and forth along with the ground. However, the heavy weight is not connected directly to the ground, and it wants to stay in place. The result is that the weight holds still, while the frame moves back and forth around it. The relative motion of the weight and frame can be turned into a recording called a seismogram. The seismogram can be analyzed later to find out when an earthquake happened and how strong it was. While modern seismographs record this motion as an electrical signal, older seismographs would use a pen to draw the signal directly on paper. In this activity you built your own old-fashioned seismograph that used a marker to record an “earthquake” on a paper strip.
For Further Exploration
- Does your seismograph work if you shake the box side-to-side or up and down? Can you design a seismograph that can record motion in multiple directions?
Thursday April 30, 2020 – The Antacid Rocket Experiment a.k.a Film Canister Rockets
Courtesy of Morin, Amanda. “The Antacid Rocket Experiment.” ThoughtCo, Feb. 11, 2020, thoughtco.com/the-antacid-rocket-experiment-2086764.
:max_bytes(150000):strip_icc()/GettyImages-491880123-580ef0525f9b58564c5d1526.jpg)
If your child has tried the Naked Egg Experiment, he has seen how the chemical reaction between calcium carbonate and vinegar can remove an eggshell. If he tried The Exploding Sandwich Bag Experiment, then he knows a little bit about acid-base reactions.
Now he can harness that reaction create a flying object in this Antacid Rocket Experiment. With some open space outdoors and a little caution your child can send a homemade rocket into the air by the power of a fizzy reaction.
Note: The Antacid Rocket Experiment used to be called the Film Canister Rockets, but with digital cameras taking over the market, it’s become harder and harder to find empty film canisters. If you can film canisters, that’s great, but this experiment recommends you use mini M&M tubular containers or clean, empty glue stick containers instead.
What Your Child Will Learn (or Practice):
- Scientific inquiry
- Observing chemical reactions
- The Scientific Method
Materials Needed:
- Mini M&Ms tube, a clean used-up glue stick container or a film canister
- Heavy paper/card stock
- Tape
- Markers
- Scissors
- Baking soda
- Vinegar
- Tissues
- Antacid tablets (Alka-Seltzer or a generic brand)
- Soda (optional)
Tissues are not a necessity for this experiment, but using tissue can help to delay the chemical reaction long enough to give your child some time to get out of the way.
Make Baking Soda and Vinegar Rockets
- Have your child sketch out and decorate a small rocket on a piece of heavy paper. Ask her to cut out the rocket and set it to the side.
- Help your child cut the “hinge” holding the cover to the M&Ms tube so it comes on and off. This will be the bottom of the rocket.
- Give her another piece of heavy paper and have her roll it around the tube, making sure the bottom of the rocket is easily accessible. Then, have her tape it tightly in place. (She may need to cut the paper to make it fit better).
- Glue the rocket she drew and cut out to the front of the tube to make the whole thing look more like a real rocket.
- Move outside to a clear, open area and open the container
- Fill it one-quarter full with vinegar.
- Wrap 1 teaspoon of baking soda in small piece of tissue.
- Warning: You must act quickly in this step! Stuff the folded tissue in the tube, snap it shut and stand it up (with the lid down) on the ground. Move away!
- Watch the rocket pop right up into the air after the tissue dissolves in the vinegar.
Make an Antacid Rocket
- Use the same rocket from the baking soda and vinegar experiment, making sure to clean it thoroughly first.
- Take off the cover and put an antacid tablet into the tube. You may have to break it into pieces to get it all to fit. You can use generic antacid tablets but Alka-Seltzer works better than generic brands.
- Add a teaspoon of water to the tube, snap on the cover and put the rocket — lid down — on the ground.
- Watch what happens once the water dissolves the antacid tablet.
What’s Going On
Both rockets are working under the same principle. A baking soda and vinegar mixture and the water and antacid combination create an acid-base chemical reaction that releases carbon dioxide gas. The gas fills the tube and the air pressure builds to a point where it is too great to be contained. That’s when the lid pops off and the rocket flies up into the air.
Extend the Learning
- Experiment with different types of paper and how much baking soda and vinegar you use. It may help make the rocket fly higher, faster, or even be coordinated to a countdown.
- Ask your child compare how the different rockets worked. Which worked better?
- Substitute soda for water in the antacid rocket and see if it works differently.
Wednesday April 29, 2020 – Universe Cards
Courtesy of https://researchparent.com
If you liked the solar system cards from a couple weeks ago, I’m hoping you’ll like these free, printable, 3-part Montessori-style universe cards as well.
These universe cards feature space terms outside our solar system such as “black hole,” “pulsar,” and “brown dwarf” as well as actual space structures like the Helix nebula and Andromeda Galaxy. When making these cards, I mainly used the National Geographic Space Encyclopedia for reference.
The following universe-related vocabulary words are included:
- universe
- Big Bang
- Milky Way Galaxy
- Andromeda Galaxy
- black hole
- neutron star
- Eagle Nebula
- Cat’s Eye Nebula
- Crab Nebula
- Carina Nebula
- Helix Nebula
- Oort Cloud
- star
- galaxy
- constellation
- nebula
- supernova
- pulsar
- quasar
- globular cluster
- dark matter
- gamma ray bursts
- white dwarf
- brown dwarf
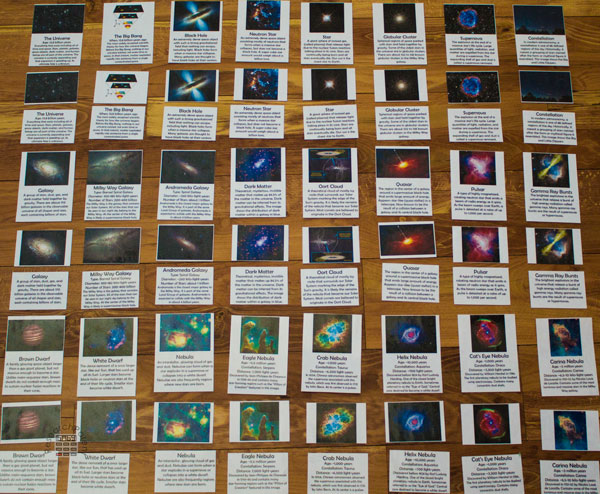
As with the solar system cards, my kids had fun playing with these universe cards even though they are pretty young. My older son is learning to sound out words, so he was able to match label cards to the pictures with some help. For example, I’ll say, “This card shows a picture of the universe (or Milky Way galaxy/pulsar/supernova/etc). Which card do you think goes with it?” He’s not 100% reading, but he can usually figure it out, especially using the control cards to compare. My preschooler likes to match the picture cards to the same picture on the control cards. Older kids could use these cards as a Montessori-style self-correcting activity to test their own knowledge or they could be used for a multi-player, memory-style matching game.
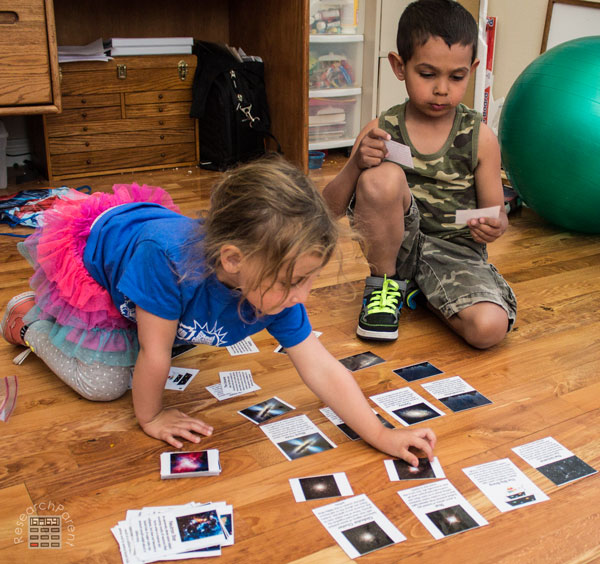
ecommended Age Range: Kindergarten, Elementary, Middle School, High School
Time Required: ~1 hour
Difficulty: Easy
Cost: Less than $3 in used supplies (Even cheaper if you don’t laminate them or use contact paper instead.)
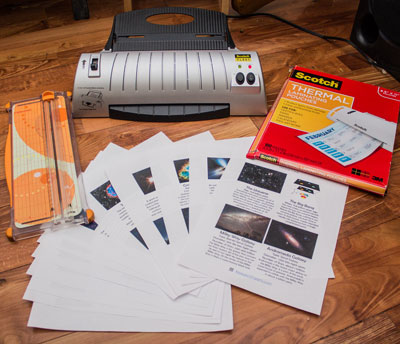
Materials:
- paper (for printing Universe Cards and the corresponding Control Cards)
- laminating pouches
Supplies & Tools:
- laminator (optional)
- scissors or paper cutter
Instructions:
- Print the Universe Cards and Control Cards. (Note: Only the first 6 pages of each document should be printed as the last 2 pages contain legal information related to sharing and image sources.)
- Laminate the pages.
- Cut out laminated cards.
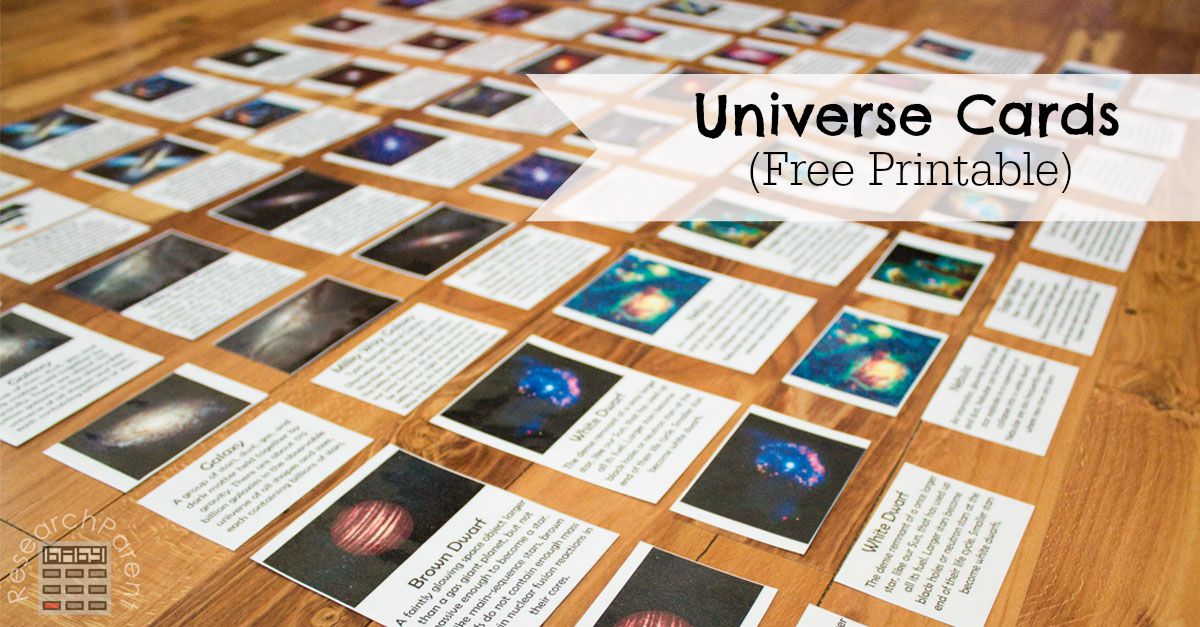
Happy Space Learning!
Tuesday April 28, 2020 – Make a Topographic Map
Courtesy of https://spaceplace.nasa.gov
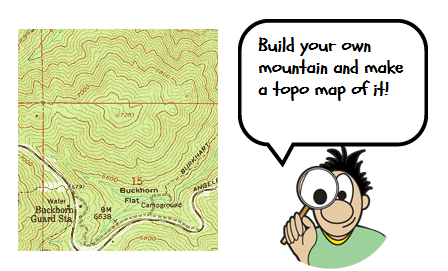
A topographic map, or “topo map,” is a way to show mountains and valleys on a flat piece of paper. Topo maps are handy and necessary for many uses, including building roads and hiking trails in the mountains. The map shows where the hills and valleys are and how steep they are.
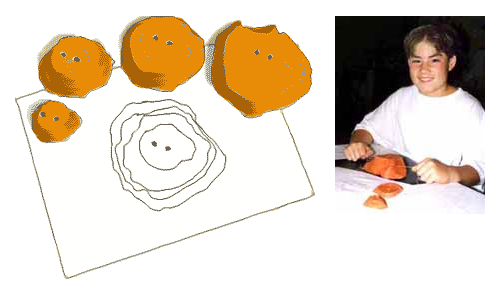
What you need:
- A lump of clay or Play-Doh® about the size of a coffee mug. (Here is a recipe for making your own modeling dough).
- Piece of cardboard or large tile on which to work the clay
- Piece of dental floss, about 2 feet (around 60 centimeters) long
- Ruler
- Piece of plain, white paper
- Long pencil
- 2 toothpicks
What to do:
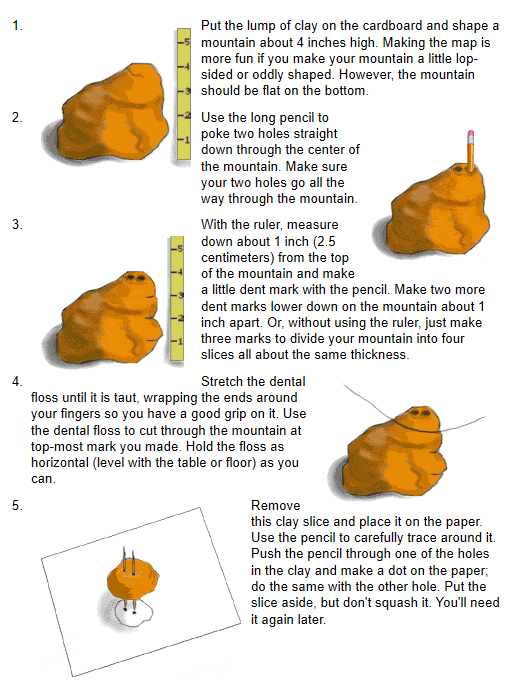
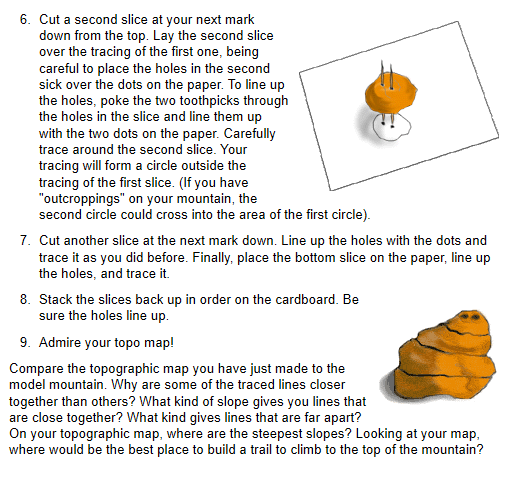
Download this activity as a PDF.
Monday April 27, 2020 – Make a Homemade Compass
Courtesy of https://www.sciencebuddies.org

Introduction
Have you ever used a compass to help you figure out what direction to go? What about while on a camping trip — have you ever needed a compass to help you navigate your way through a forest? Magnetic compasses work based on Earth’s magnetic field. In this science activity, you will get to make your own magnetic compass out of a sewing needle, piece of cork, and cup of water. How well do you think it will work? Get ready to find out!
Credits
Teisha Rowland, PhD, Science Buddies
Materials
- A cork
- Scissors for cutting the cork
- A cup, drinking glass, or bowl
- Water
- A magnet. It can be a flat refrigerator magnet or a more powerful magnet, such as a neodymium magnet. A stronger magnet will work better.
- A pair of pliers
- Metal sewing needle
- An adult

Prep Work
- Be careful when handling the magnet, especially if you are using a strong magnet, like a neodymium magnet. Keep the magnet away from other magnets and electronic devices, such as computers, cell phones, and TV screens.
- Use caution when inserting the needle into the cork. Needles are sharp!
Procedure
- Rub the magnet against the sewing needle at least five times. (If you are using a weaker magnet, such as a flat refrigerator magnet, rub the needle at least a dozen times.) Always rub the magnet in the same direction against the needle. Your needle should now be magnetized.

2. Now cut off about ¼ inch of the cork from one of its ends, making a small cork disc that is about ¼ inch tall.

3. Carefully push the needle through the side of the disc by using the pair of pliers. Push the needle all the way through the disc so that about the same amount of needle shows on either side of the disc.


4. Fill a cup, drinking glass, or bowl with at least an inch of water.
5. Put the cork disc (with the needle) on the water in the cup. Try to keep the disc floating in the center of the water, away from the sides of the cup.
What does the needle do? When it stops moving, what direction does it point towards?

Does your homemade compass seem to work well? How is it limited in its use?
What Happened?
You should have seen that the needle in the homemade compass aligned itself along the Earth’s north and south poles. Why is this? When you rubbed the magnet against the sewing needle, you magnetized the needle, effectively making it a weak, temporary magnet. Because magnets interact with each other (pushing against each other or pulling each other together), the magnetized needle can interact with Earth’s magnetic field. Although Earth’s magnetic field is relatively weak, it could clearly affect the needle because it was allowed to freely float in the cork disc on the water. Specifically, once it stopped moving, the needle should have aligned itself along Earth’s magnetic field, lining up along the north-south axis. This means that one end of the needle should have pointed north, while the other pointed south. The same end should have always pointed the same direction. (You can do some more research to figure out how to make a compass that always has the needle’s tip point a specific direction, i.e. either north or south.)
Digging Deeper
People have known about magnetism for thousands of years. Because of magnetism, two magnets will push against each other or be pulled together. This can cause amazing things to happen, like making an object hover above the ground because it is being pushed up by the magnetic force. Magnetism can also help people navigate; because the Earth has a magnetic field, compasses can be made using a small magnetized bar or needle that points a certain direction (i.e., north or south) based on the Earth’s magnetic field.
But while the phenomenon of magnetism has been known of for a long time, the first magnetic compasses used for navigation were not invented until relatively recently, around 1000 C.E. to 1100 C.E. In this science activity, you get to make your own compass and the process may help you understand some of the challenges that early magnetic compass makers encountered!
For Further Exploration
- Put a magnet next to your compass. What happens to the needle as the magnet is moved close to it? How close does the magnet need to be to affect the compass? You could try this with a steel object (such as a nail or possibly the pliers) too.
- If you have magnets with different strengths, such as a flat refrigerator magnet and a neodymium magnet, try making multiple compasses using the different magnets to magnetize the needles. How well do the different compasses work compared to each other?
- There are other ways you can make an inexpensive magnetic compass at home or while you are outdoors. For example, instead of using a piece of cork, you could try using a small leaf and setting the needle on top of the leaf while it floats in still water. How does a compass made using a leaf compare to one made using a piece of cork? How else could you make a magnetic compass?
Friday April 24, 2020 – How Does a Hovercraft Hover?
Courtesy of https://www.sciencebuddies.org
Introduction
Have you ever ridden on a hovercraft? It is like gliding on a cushion of air! In fact, this is exactly what is going on. A hovercraft is a vehicle that glides over a smooth surface by hovering upon an air cushion. Since a hovercraft can travel on top of flat land or water, it is an amphibious vehicle. In this activity, you will get to build your own mini hovercraft using a CD or DVD, a pop-top lid from a plastic bottle, some glue, and a balloon. How will different amounts of air in the balloon affect how long the hovercraft hovers?
Credits
Teisha Rowland, PhD, Science Buddies
Materials
- Pop-top lid from a plastic drinking bottle. Reusable plastic drinking bottles sometimes use these kinds of lids.
- An old CD or DVD that you are willing to part with (it will not be playable after this activity)
- A medium-sized balloon (large enough to inflate to at least 11 inches around) Craft glue or super glue
- Stopwatch or timer
- Large flat surface for testing the hovercraft

Procedure
- Remove a pop-top lid from a plastic drinking bottle.
- Glue the base of the pop-top lid to the CD (or DVD) so that the lid covers the hole in the center of the CD. If you use super glue, have an adult help, use caution, and follow all of the instructions and safety warnings on the packaging. Allow the glue to dry completely.
- Make sure the pop-top lid is closed.
- Blow the balloon up as large as you safely can without popping it. Then pinch the neck so that no air can escape.
- Stretch the neck of the balloon over the pop-top lid, being careful not to let any air escape. Carefully center the balloon’s opening above the pop-top lid opening. Your hovercraft is now ready to do some hovering!

6. Tip: If the pop-top lid detaches from the CD and you used craft glue to glue them together, try carefully re-gluing them using super glue.
7. Place the hovercraft on a flat surface. Start your stopwatch or timer, open the pop-top lid, and push the hovercraft. Stop the stopwatch when the hovercraft stops hovering.
How long did the hovercraft hover for?
8. Detach the balloon from the pop-top lid.
9. Repeat this process two more times, blowing the balloon up as large as you safely can, attaching it to the pop-top lid, and timing how long the hovercraft hovers for. Did the hovercraft hover for the same amount of time each time, or was there some variation?
10. Repeat this process three more times, but this time only blow the balloon up to a medium size. For example, if it took three breaths to blow the balloon up as large as you safely could, use only two breaths or a little less to blow it up now.
How long did the hovercraft hover when the balloon was only a medium size? Did the hovercraft hover for about the same amount of time each of the three times you tested it using a medium-sized balloon?
11. Repeat this process three more times, but this time only blow the balloon up to a small size. For example, if it took three breaths to blow the balloon up as large as you safely could, use only one breath or less to blow it up now. How long did the hovercraft hover using a small-sized balloon? Did the hovercraft hover for about the same amount of time each of the three times you tested it using a small-sized balloon?
Overall, which size balloon allowed the hovercraft to hover for the longest amount of time? Which allowed it to hover for the shortest amount of time? Why do you think this happened?
What Happened?
While modern hovercrafts often use propellers on top of the hovercraft to push air beneath the hovercraft, in this activity you used a balloon to do this instead of propellers. The air coming from the balloon traveled through the pop-top lid to go under the hovercraft. This means that while you tested balloons that were inflated to different sizes, because the pop-top lid stayed the same, the opening that allowed air to go beneath the hovercraft was always the same size. When the balloon was inflated to the largest size, it held the greatest amount of air and should have allowed the hovercraft to hover for the longest amount of time. Likewise, when the balloon was inflated to its smallest size, it held the least amount of air and so the hovercraft should have hovered for the least amount of time, and when the balloon was inflated to a medium size, it should hovered for an in-between amount of time. There may have been some variation (of just a few seconds) between the three trials because it is nearly impossible to fill the balloon with exactly the same amount of air each time.
Digging Deeper
Because a hovercraft is a vehicle that glides over a smooth surface by hovering upon an air cushion, it is also called an Air-Cushion Vehicle, or ACV. How is the air cushion made and how does it allow the vehicle to glide so freely? Vents or currents of slowly moving, low-pressure air are ejected downwards against the surface that is close below the hovercraft. In modern hovercrafts, often propellers on top of the hovercraft create the air currents and these are pushed beneath the hovercraft with the use of fans. Surrounding the base of the hovercraft is a flexible skirt, also called the curtain, which traps the air currents, keeping them right below the hovercraft. The trapped air currents can create an air cushion on any smooth surface, land or water! The air cushion greatly reduces the friction of the vehicle, allowing it to glide freely upon the smooth surface below.


For Further Exploration
- In this activity, you approximately made the balloon different sizes. However, you could more accurately measure the different balloon sizes and see how this correlates to the time the hovercraft hovers for. Repeat this activity but this time measure the circumference of the balloon each time and estimate the volume of air inside the balloon by calculating the volume of a sphere. Alternatively, you can use a water displacement method (dunk the filled balloon in a large metric measuring container and determine the change in height of the water) or an air displacement method (fill a large graduated cylinder with water in a large tub of water, invert the graduated cylinder under water so that the water in it does not escape, release the air from the balloon into the opening of the cylinder so that the air travels up into the cylinder, and then look at how much air is trapped in the cylinder). How does the volume of the balloon correlate with how long the hovercraft hovers for?
- Test the hovercraft on different surfaces. Which type of surface does the hovercraft work best on?
- Can you improve upon this hovercraft design? Think about features of this hovercraft you can change, such as the materials it is made out of, the opening size of the lid, the hovercraft’s shape, or its size. Could you add a curtain somehow to better contain the air cushion? Tip: Foam board cut into different shapes may work well instead of a CD or DVD. What modifications make the hovercraft hover even better? Can you use the action of a modified hovercraft for any practical purpose, or to solve a problem?
Thursday April 23, 2020 – Make a Telescope
Courtesy of https://kids.nationalgeographic.com
If you want a better view of birds, treetops, or even the night sky, you and your family can build your own simple telescope. Use this make-it-yourself device to explore the world, then check out these tips to keep track of what you see.
You Will Need
- Two empty paper towel tubes
- Scissors
- Masking tape
- Paint, markers, or crayons to decorate your telescope
- 2 convex lenses. If your parents have old reading glasses they aren’t using, ask them to help you remove the lenses from the frame. Make sure the glasses are reading glasses and not glasses for helping to see things far away. If you don’t have old reading glasses to use, you can ask your parents to order convex lenses online.
Step 1

Choose one of your tubes to be the inner tube. Cut that tube lengthwise (all the way up the side). Wrap one edge of the cut side slightly over the other edge and hold it in place with one hand.
Step 2
Insert the cut tube into the other paper towel tube. Let go of the inner tube so that it can expand inside the outer tube. If the inner tube is not sliding smoothly, remove it and wrap the edge slightly tighter. Then reinsert the inner tube into the other paper towel tube until it is just right.
Step 3
Using masking tape, secure one of the lenses to the outer edge of the inner tube. The curve of the lens should be facing the inside of the tube.
Step 4
Then secure the second lens to the outer edge of the second tube, with the curve of the lens pointing outside of the tube. It’s OK if your lenses are bigger than the tube. Try to only tape around the rim of the lenses so you don’t cover too much.
Step 5

Place your eye against the lens of the inner tube. Aim your telescope at faraway animals or tall treetops (but never use a telescope to look at the sun). Focus by sliding the inner tube in and out until the image becomes clear.
WHAT’S GOING ON?
Your telescope is a “refracting telescope,” because it uses lenses to help gather more light than your eye could possibly do on its own. The scope uses two lenses to bend light, which makes an object appear closer than it really is. The size of the image produced by the telescope depends on the curvature of the lenses. Lenses with different curvatures will change the magnification of the telescope.
Wednesday April 22, 2020 – Generate Electricity with a Lemon Battery
Courtesy of https://www.sciencebuddies.org

Introduction
Can you imagine how your life would change if batteries did not exist? If it were not for this handy storage of electrical energy, the radio in a car would not function, nor would the lights. A pacemaker or hearing device would need to be plugged into a wall outlet in order to function, and do not forget all portable electronic devices like phones, digital music players, or tablets, which are all powered by batteries.
With all the frustration you might have endured coping with dead batteries, it might surprise you how easy it is to make one out of household materials. Try out this activity, and it might just charge up your imagination.
Credits
Sabine De Brabandere, PhD, Science Buddies
Materials
- Pennies
- Water
- A few drops of dishwashing soap
- Paper towels
- Aluminum foil
- Scissors
- Ruler
- Plate
- Knife
- At least one lemon (preferably with a thin skin)
- Plastic-coated paper clips (2)
- An adult
Prep Work
- Wash your pennies in soapy water, then rinse and dry them off with a paper towel. This will remove any dirt sticking to the pennies.
- Cut out three aluminum foil rectangles, each 3 centimeters (cm) by 20 cm. Fold each strip in thirds, lengthwise, to get three sturdy 1 cm by 20 cm aluminum strips.

Procedure
- Put the lemon on a plate, on its side, and carefully use the knife to make a small cut near the middle of the lemon (away from either end). Make the cut about 2 cm long and 1 cm deep.

2. Make a second, similar cut, parallel to the first, so the cuts are about 1 cm apart.

3. Push a penny in the first cut until it sits halfway down into the lemon. Part of the penny should be in contact with the lemon juice, as a chemical reaction between the copper from the penny and the lemon juice plays an essential role in generating electricity. The copper penny that is in contact with the lemon juice is called the electrode of your battery. Note: If your lemon has a very thick skin, you might need to cut away some lemon peel.
4. Slide one of the aluminum strips in the second cut until you are sure part of the aluminum is in contact with the lemon juice. The aluminum strip that sits inside the lemon is the second electrode of your battery. It will react with the lemon juice to generate electricity.
Do you think it is important for the aluminum to be in contact with the lemon juice?

5. You just made a battery! It has two electrodes made of different metals (copper and aluminum) and an electrolyte (the lemon juice) separating them.
Do you think this battery is generating electricity or is there still something missing?
6. Your battery can generate electricity, but will only do so when the electrodes are connected with something that conducts electricity. To create a connection, attach the second aluminum strip to the part of the penny sticking out of the lemon with a plastic-coated paperclip. Make sure the aluminum touches the penny so electricity can pass between the copper penny and the aluminum foil.
You used an aluminum strip to create a connection; would you expect a plastic strip to work as well?

7. As soon as the two aluminum strips touch each other, electricity will be produced in the battery and flow through the aluminum strips, from one electrode to the other. Since you cannot see the electricity flowing, let us try to feel it. Let the two strips of aluminum touch a sensitive area on your body, like your fingertip or tongue, with about 1 cm in between the places where the aluminum touches the body part.
Can you feel a tingling, created by a small amount of electricity running from one aluminum strip to the other through your body?

8. Some of our test persons needed a slightly more powerful battery before they could feel the tingly sensation created by the electricity. To increase the power, build a second battery, identical to the first. Remember a battery consists of two electrodes (the copper penny and the aluminum foil) separated by an electrolyte (the lemon juice). You can choose a different spot on the lemon you just used (as shown in the figure), or use a second lemon to build a second battery. Note that you only need one aluminum strip to build a second battery. You will create connections in the next step.

9. To connect the second battery to the first, find the aluminum strip of the first battery that serves as an electrode (it has its end inserted in the lemon). Use a plastic-coated paperclip to attach the other end of this aluminum strip to the penny of the second battery (which if you are using one lemon, is just on another part of your lemon). This connects the aluminum electrode of the first battery to the copper electrode of the second battery.

10. Test this set of connected batteries in a similar way as you tested the single battery, bringing the ends of the two aluminum foil strips sticking out of your battery set (those that have a free end) in contact with your fingertip or tongue.
Can you feel electricity running? If you could feel it the first time, is this any different?
Note that some people are able to clearly describe the intensity of the electricity running through their fingertip or tongue, while others will only be able say whether they feel it or not.

11. If you still cannot feel it, check if each electrode (pennies and the aluminum strips stuck in the lemon) are inserted deep enough so they are in contact with lemon juice, make sure there is firm contact between the penny and its attached aluminum strip, and make sure the aluminum strips are not touching each other. If all is correct, you might need slightly more electricity to feel the tingling generated by electricity running through your body. You can test another person to see if he or she can feel the electricity, or you can add one more lemon battery to your set.
12. Now that you can detect whether electricity is generated or not, try some different configurations.
Cleanup
- Pull out your pennies and throw away the lemon and aluminum strips.
What Happened?
Did you instantly feel a tingling in your fingertip or tongue, or did you need two or more batteries to feel the electricity run?
The tingly feeling is due to a small amount of electricity running through your body. The electricity was generated by your lemon battery. Connecting the aluminum strips to each other or your body allows the electricity to flow. As soon as you let the aluminum strips touch each other, the tingly sensation disappeared. The electricity will run through the aluminum back to the battery, which is easier than running through your body.
Digging Deeper
Batteries are containers that store chemical energy, which can be converted to electrical energy, or what we call electricity. They depend on a chemical reaction to generate electricity. (Side note: Chemical reactions that generate electricity are called electrochemical reactions .) The reaction typically occurs between two pieces of metal, called electrodes, and a liquid or paste, called an electrolyte. The battery you made has one copper electrode (from the penny) and one aluminum electrode (from the aluminum foil) separated by lemon juice, the electrolyte. It will generate electricity as soon as the electricity has a path to flow from one electrode to the other. You created this path using strips of aluminum, a material that conducts electricity well.
By connecting your battery to a body part, you allow the small amount of electricity it generates to run through that body part. This amount of electricity can create a tingly feeling in a fingertip or tongue, two sensitive areas of the body. Experiences will differ from person to person. Some people might only feel the larger amount of electricity generated by connecting several batteries in a particular way, as described in the project.
Letting the aluminum strips touch creates a very easy way for the electricity to run from one electrode to the other, so almost no electricity will travel through your body and the tingly sensation disappears.
Warning: Letting large amounts of electricity (like the electricity delivered by a wall outlet) run through a body part can create serious damage. In general, batteries are safe to use in home electronics projects.
For Further Exploration
- See what happens if you replace an aluminum strip with a plastic piece, an unfolded metal paperclip, or a toothpick.
- Try different types of metals as electrodes for your batteries. Do you think a battery with two pennies as electrodes would generate electricity? What about a battery with a penny and a nickel? Note that some combinations might generate electricity, but the amount generated might be below your ability to feel it. Connecting two or more of these batteries might help you identify good combinations.
- You used a lemon to provide the electrolyte for your battery. Do you think other vegetables or fruits would work as well? Would a potato, apple, or onion battery work? Would one particular fruit or vegetable outperform the others?
- Scientists call the way you connected the batteries in this activity connecting batteries in series. Do you think the way you connect two batteries makes a difference in the amount of electricity you feel? Try it out; connect the two copper electrodes with each other and connect the two aluminum electrodes with each other. (Note: You will need an extra strip of aluminum folded three times to do this.) Scientists call this connecting batteries in parallel. Test both ways of connecting batteries and compare; maybe you can feel the difference.
- If you have an LED (light-emitting diode) available, investigate how many lemon batteries are needed to light up the LED.
Tuesday April 21, 2020 – Do-It-Yourself DNA
Courtesy of https://www.sciencebuddies.org
Introduction
Have you ever wondered how scientists get a sample of DNA from a plant, animal, or other organism? All living organisms have DNA. DNA, which is short for deoxyribonucleic acid, is the blueprint for almost everything that happens inside the cells of an organism — overall, it tells the organism how to develop and function. DNA is so important that it can be found in nearly every cell of a living organism. In this activity, you will make your own DNA extraction kit from household chemicals and use it to extract DNA from strawberries.
Credits
Teisha Rowland, PhD, Science Buddies
Materials
- Rubbing alcohol
- Salt
- Water
- Strawberries (3)
- Dishwashing liquid for hand-washing dishes
- Measuring cup for liquids
- Measuring spoons
- Glass or small bowl
- Funnel
- Tall drinking glass
- Cheesecloth
- Re-sealable plastic sandwich bag
- Small glass jar, e.g., spice jar or baby food jar
- Bamboo skewer, available at most grocery stores. If you are using a baby food jar or a short spice jar as your small glass jar, you could use a toothpick instead of a skewer.

Instructions
Prep Work
- Chill the rubbing alcohol in the freezer. You will need it to be very cold to do the activity.
Procedure
- Mix 1/3 cup (C) water, ½ teaspoon salt, and 1 tablespoon (tbsp.) dishwashing liquid in a glass or small bowl. Set the mixture aside for now. This is your extraction liquid, which is what you will use to extract (or remove) the DNA from the strawberries.
- Completely line the funnel with cheesecloth. Put the funnel’s tube into a tall drinking glass (not the glass with the extraction liquid in it). Set this setup aside for now.

3. Remove the green tops from the strawberries and discard the tops. Put the strawberries in a re-sealable plastic sandwich bag and push out all of the extra air. Seal the bag tightly.
4. With your fingers, squeeze and smash the strawberries for two minutes. How do the smashed strawberries look?

5. Add 3 tbsp. of the extraction liquid you prepared to the strawberries in the bag. Push out all of the extra air and reseal the bag.
How do you think the detergent and salt will affect the strawberry cells?
6. Squeeze the strawberry mixture with your fingers for one minute. How do the smashed strawberries look now?

7. Pour the strawberry mixture from the bag into the funnel. Let it drip through the cheesecloth and into the tall glass until there is very little liquid left in the funnel (only wet pulp remains). How does the filtered strawberry liquid look?
8. Pour the filtered strawberry liquid from the tall glass into the small glass jar so that the jar is ¼ full.
9. Measure out ½ C of cold rubbing alcohol. Tilt the jar and very slowly pour the cold rubbing alcohol down the side of the jar. Pour until the alcohol has formed approximately a one-inch deep layer on top of the strawberry liquid. You may not need all of the ½ cup of alcohol to form the one-inch layer. Do not let the strawberry liquid and alcohol mix.
10. Study the mixture inside of the jar. The strawberry DNA will appear as gooey clear/white stringy stuff.
Do you see anything in the jar that might be strawberry DNA? If so, where in the jar is it?

11. Dip the bamboo skewer into the jar where the strawberry liquid and alcohol layers meet and then pull up the skewer.
Did you see anything stick to the skewer that might be DNA? Can you spool any DNA onto the skewer?
What Happened?
When you added the mixture of salt and detergent (i.e., the dishwashing liquid) to the smashed strawberries, the detergent helped lyse (or pop open) the strawberry cells. This caused the cells to release their DNA into the liquid in the bag. At the same time, the salt helped create an environment where the different strands of DNA could gather together in a clump, making it easier for you to see them. (When you added the salt and detergent mixture, you probably mostly just saw more bubbles form in the bag, due to the detergent.) When you added the cold rubbing alcohol to the filtered strawberry liquid, the alcohol should have made the DNA come together and separate itself from the rest of the liquid. You should have seen the white/clear gooey DNA strands in the alcohol layer, as well as between the two layers. A single strand of DNA is extremely tiny, too tiny to see with the naked eye, but because the DNA clumped together in this activity you were able to see just how much DNA three strawberries have when combining all of their octoploid cells! (“Octoploid” means they have eight genomes, or sets of their genes.)
Digging Deeper
Whether you are a human, rat, tomato, or bacterium, each cell will have DNA inside of it (with some rare exceptions, such as mature red blood cells in humans). Each cell has an entire copy of the same set of instructions, and this set is called the genome. Scientists study DNA for many reasons. They can figure out how the instructions stored in DNA help your body to function properly. They can use DNA to make new medicines. They can genetically modify foods to be resistant to insects. They can figure out the suspect of a crime. They can even use ancient DNA to reconstruct evolutionary histories!
To get the DNA from a cell, scientists do a DNA extraction. There are many DNA extraction kits available from biotechnology companies for scientists to use. During a DNA extraction, a detergent will cause the cell to pop open, or lyse, so that the DNA is released into surrounding liquid. Then the DNA is separated from the rest of the liquid (a process called precipitation) by adding alcohol. In this activity, strawberries are used because each strawberry cell has eight copies of the genome, giving them a lot of DNA per cell. (Most organisms only have one genome copy per cell.)
For Further Exploration
- You can try this DNA extraction activity to purify DNA from lots of other things. Grab some oatmeal or kiwis from the kitchen and try it again! Which foods give you the most DNA?
- If you have access to a milligram scale (called a balance), you can measure how much DNA you get (called a yield). Just weigh your clean bamboo skewer and then weigh the skewer again after you have used it to fish out as much DNA as you could from your strawberry DNA extraction. Subtract the initial weight of the skewer from its weight with the DNA to get your final yield of DNA. What was the weight of your DNA yield?
- Try to tweak different variables in this activity to see how you could change your strawberry DNA yield. For example, you could try starting with different amounts of strawberries, using different detergents, or using different starting sources of DNA (such as oatmeal or kiwis). Which conditions give you the best DNA yield?
Monday April 20, 2020 – Seed Germination Experiment
Courtesy of https://www.stem.org.uk
Watching seeds grow is an amazing science lesson for kids. Our seed germination experiment gives kids the opportunity to see up close how a seed grows what would actually be happening under the ground! Our awesome seed growing activity turned out amazingly well, and we loved checking on the progress each day! Simple science activities are great for young learners!
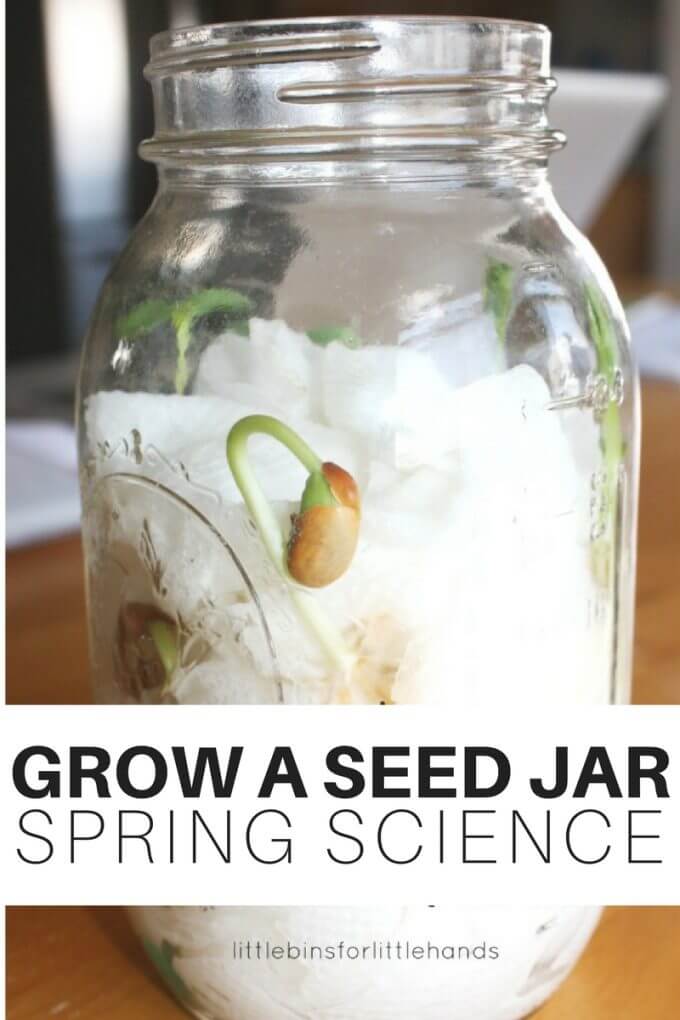
HOW A SEED GROWS
This simple to set up seed jar was one of our favorite spring science projects that you can do inside! We had an awesome time examining and observing the growth of our seed germination experiment.
Preschool science can be a wonderful experience that introduces young kids to the world around them! Spring is full of new beginnings in nature that can be explored.
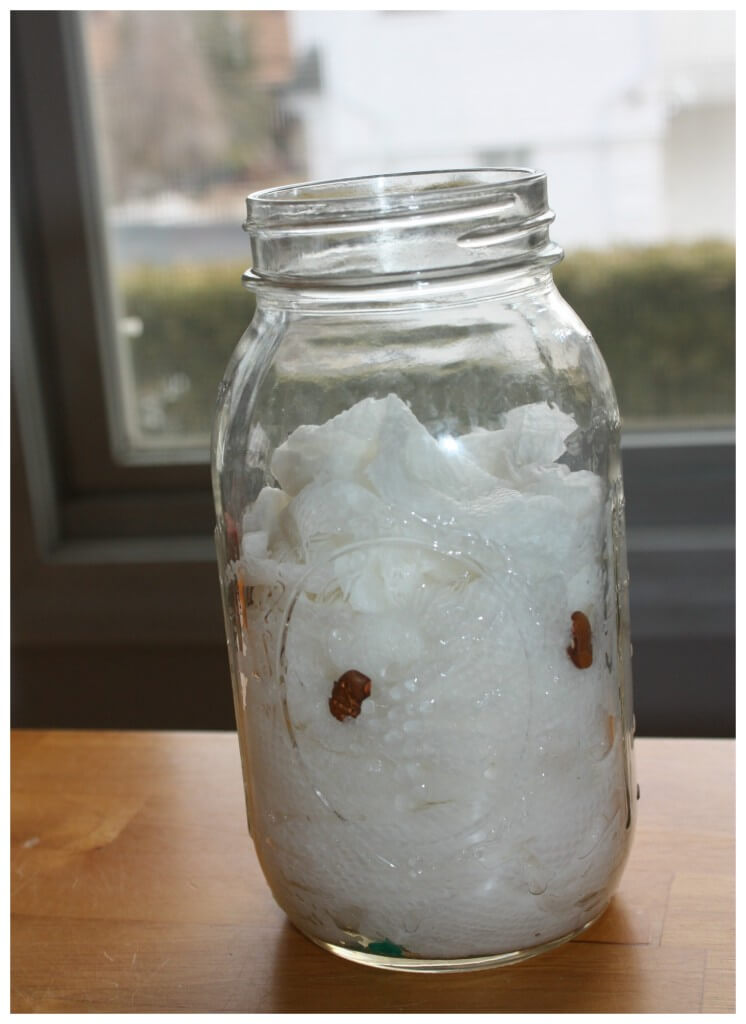
It all starts with a single seed.
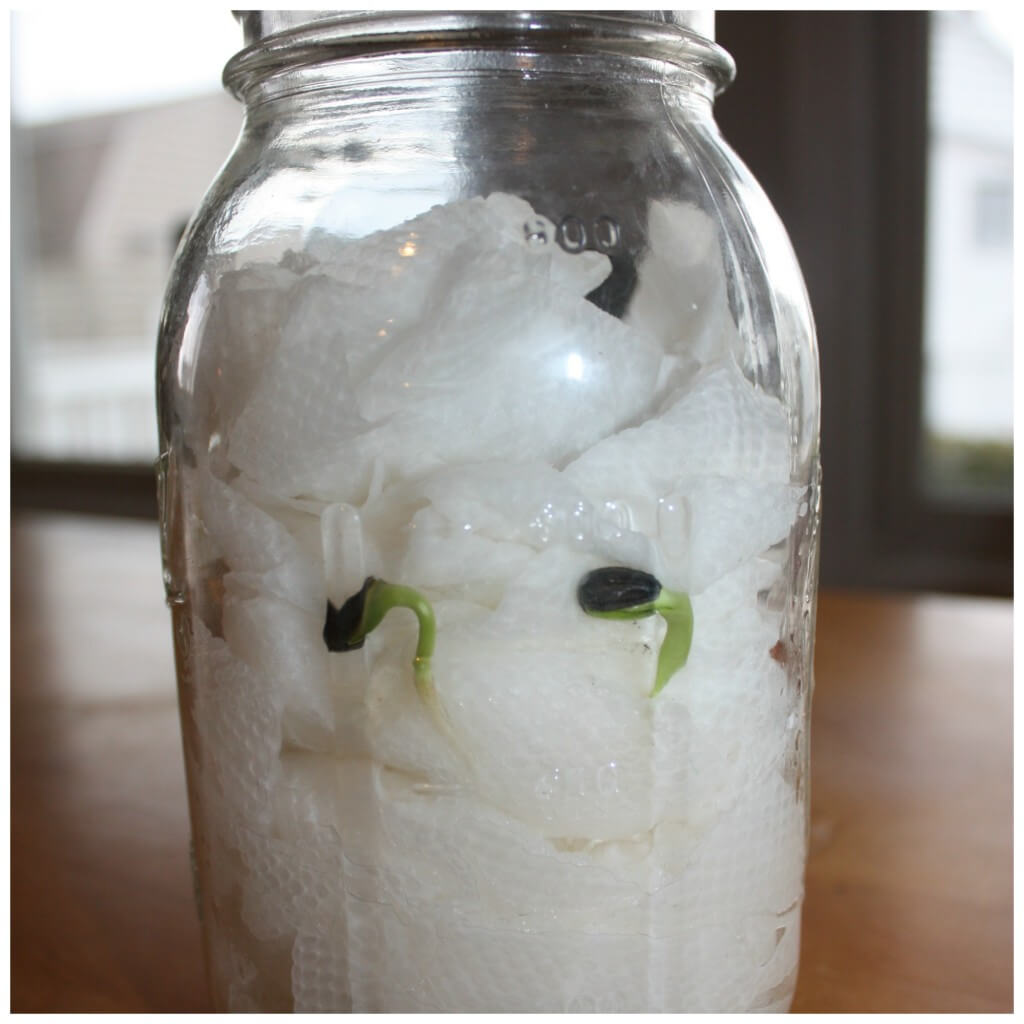
It’s truly amazing to watch how a seed grows and using a mason jar gives you a front row seat for observing it all! Sprouting seeds is perfect for a SPRING STEM Activity.
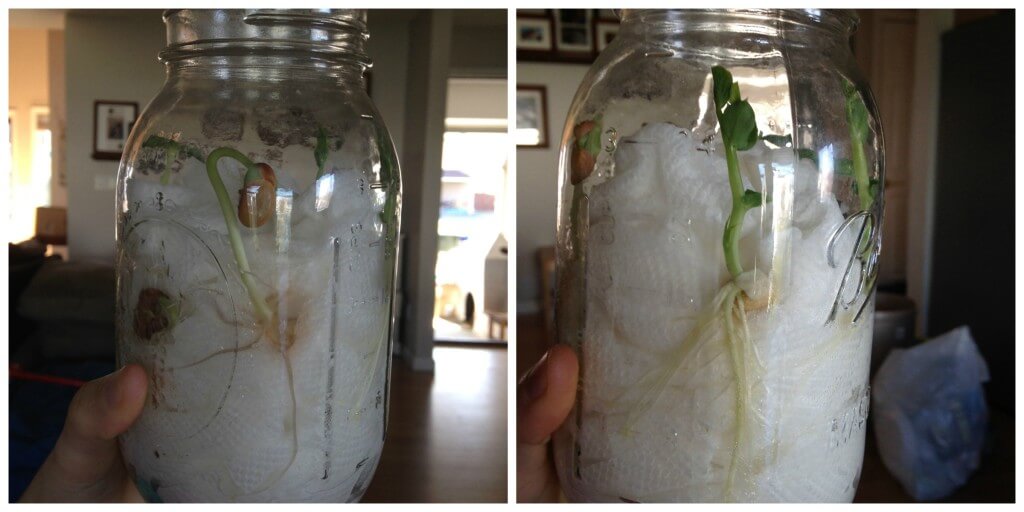
SEED GERMINATION
I first saw this awesome seed germination activity done by How Wee Learn. Looking around my kitchen, I had everything I needed to set it up immediately! It looked like an awesome way to see how a seed grows, so got it started right away!
SEED JAR SUPPLIES:
- Paper Towels
- Water
- Seeds (Pea and bean seeds grow quickly)
- Large jar
We also enjoyed the book, How A Seed Grows by Helene Jordan which inspired another seed activity with eggshells!
HOW TO SET UP YOUR SEED EXPERIMENT:
Our mason jar includes sunflowers, peas, and green beans!
STEP 1: Fill the jar with paper towels. Kids can fold them and push them down into the jar. This is also great work for little hands.
STEP 2: Gently water your seed jar to wet the paper towels. DO NOT FLOOD IT!
STEP 3: Carefully push seeds down into the paper towels around the edge of the jar so they can still be seen. Make sure they are firmly held in place.
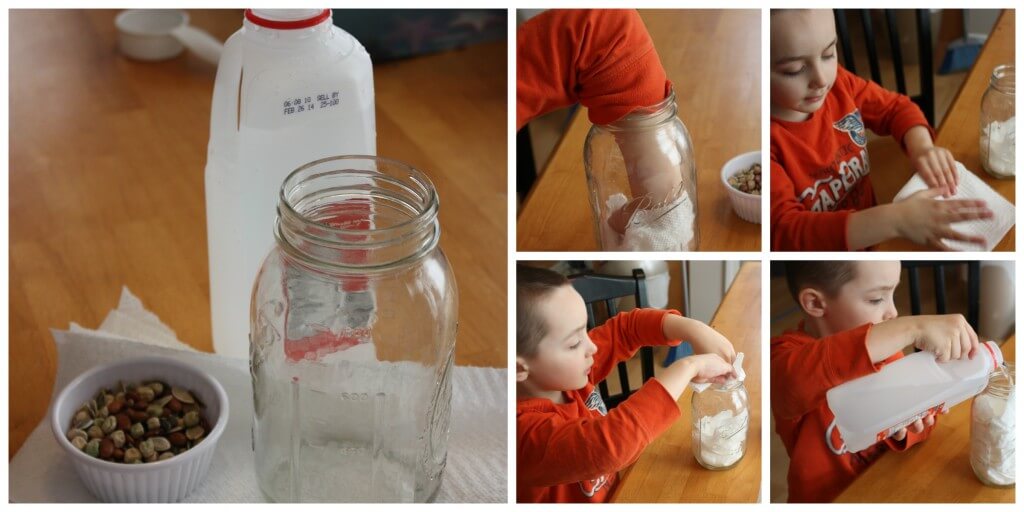
BEAN SEED GERMINATION
This type of activity makes a great plant science fair project for multiple ages. Get your magnifying glass out and check out all the angles of the seeds. Can you find the different parts of the seed growth listed below?
What do you see in your seed jar?
- You are looking for a root to pop out of the side.
- Next, you are looking for root to push down into the soil.
- Then, you are looking for root hairs.
- Next, you are looking for the seed to push up while the root hairs push down.
- Lastly, you are looking for the shoots to come up!
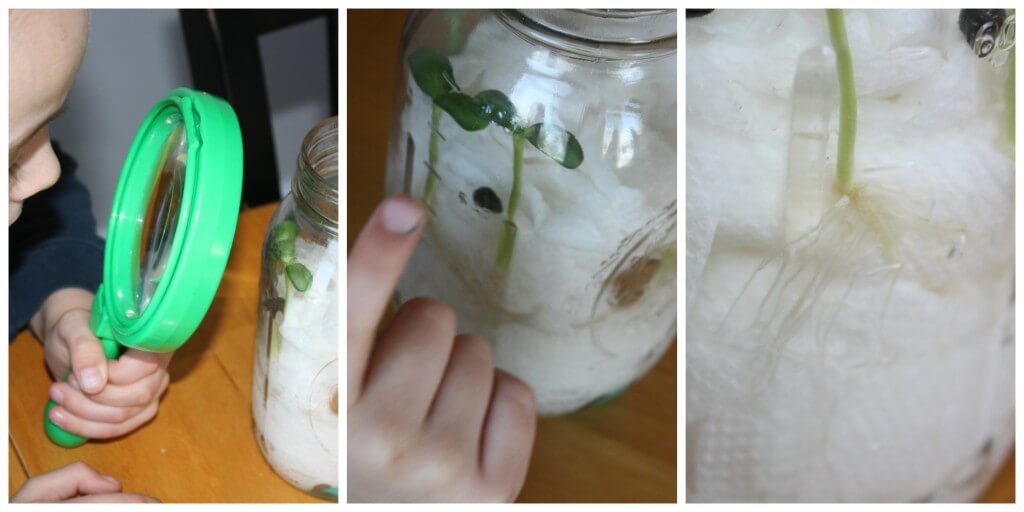
The mason jar gives a stunning view of this seed experiment! My son loved being able to see the changes so easily. Do you know you can also grow crystals in mason jars for a fun science activity!
SEED GERMINATION IN THE CLASSROOM OR AT HOME
Setting this up as a science experiment is a great way to share the activity with multiple ages or developmental levels. Older kids can use a science experiment worksheet to journal about how the seeds are growing while younger kids can draw or simply observe the changes!
SEED EXPERIMENT VARIATIONS
You can also explore how fast different seeds germinate by comparing different kinds of seeds under the same conditions. We tried sunflower seeds, peas, and beans in our seed jar.
Or keep the type of seed the same and set up two mason jars to explore whether seeds need light to germinate. Place one jar where it will get natural light and one in a dark cupboard.
Another idea to investigate is whether seeds need water to germinate and how much. Set up three jars, and measure out how much water goes into each so that one is fully wet, half wet and one has no water.
HOW TO GERMINATE SEEDS FASTER
One easy way to get your seeds to germinate faster is to presoak them in a shallow container of warm water for up to 24 hours. That will soften the hard outer shell of the seed. Don’t soak for longer as they may go moldy.
It was also interesting to talk about what was happening with the different seeds and how they changed over the duration of the experiment.
Sunflower seeds were the fastest to pop a root but never made it out of the jar.
Bean seeds took the longest to pop a root but finally did and made it out of the jar.
Pea seeds grew rapidly once the root popped out and grew the tallest.
Simple beginnings with the sunflower seeds! Then the pea and lastly the bean! It took about three days to see some action with the seeds!
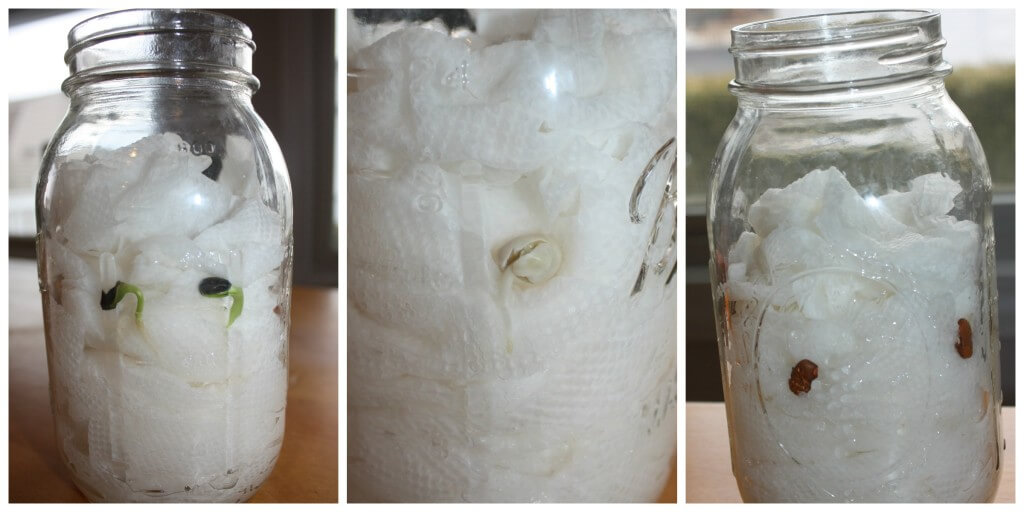
Amazing to see the pea take off in the seed jar once the root popped out!
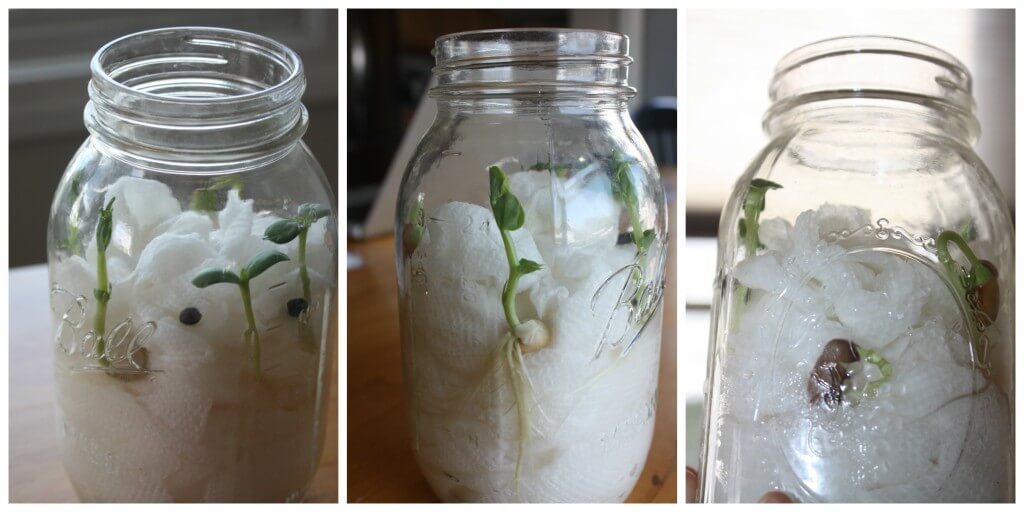
My son enjoyed telling me about the root hairs he could see every day! So fun to see it flourish and check out the results! It’s a perfect spring science activity at home or in the classroom.
Friday April 17, 2020 – Build a CD Spectrometer
Courtesy of https://www.stem.org.ukCD Spectrometer Objectives
- Students build a basic spectrometer.
- Students use their spectrometer to look at several light sources.
- Students understand that the wavelength of light given off by something can tell us what it is made of.
Resources required
Per student:
- empty cereal box
- CD
- sellotape
- scissors
- an adult
Teaching activities
Introduction
In this activity students work in pairs or individually to make a spectrometer, one of the most common instruments used in space research. They can then use them to analyse the light coming from a fluorescent light and the solar spectrum coming from the sky. Scientists use spectrometers to learn about distant objects in the Universe.
Activities
Take an empty cereal box and cut a slot on one of the long sides near the end. Make the slot at a 45° angle. (If using scissors it is easier to cut the box if you squeeze the two sides of the corner together).
Cut a slit 1mm wide on the other side of the box directly opposite the middle of the diagonal slot. This will be the “entrance aperture”, the bit that you point at the light you want to analyse.
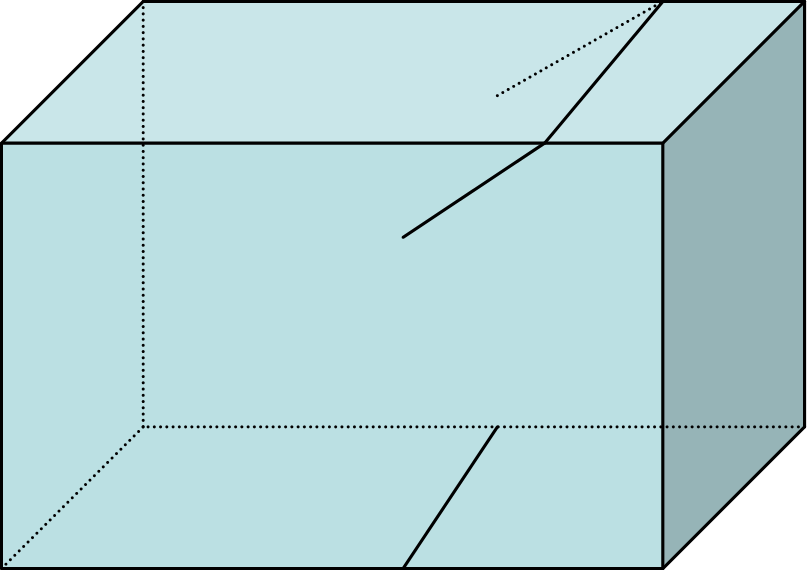
On the short edge nearest the slot cut a *SMALL* hole that enables you to look at the CD. (If you make a small piercing first with a pencil/pen cutting is easier).

Apart from this, the rest of the box needs to be as light-tight as possible, so tape the other sides tightly shut.
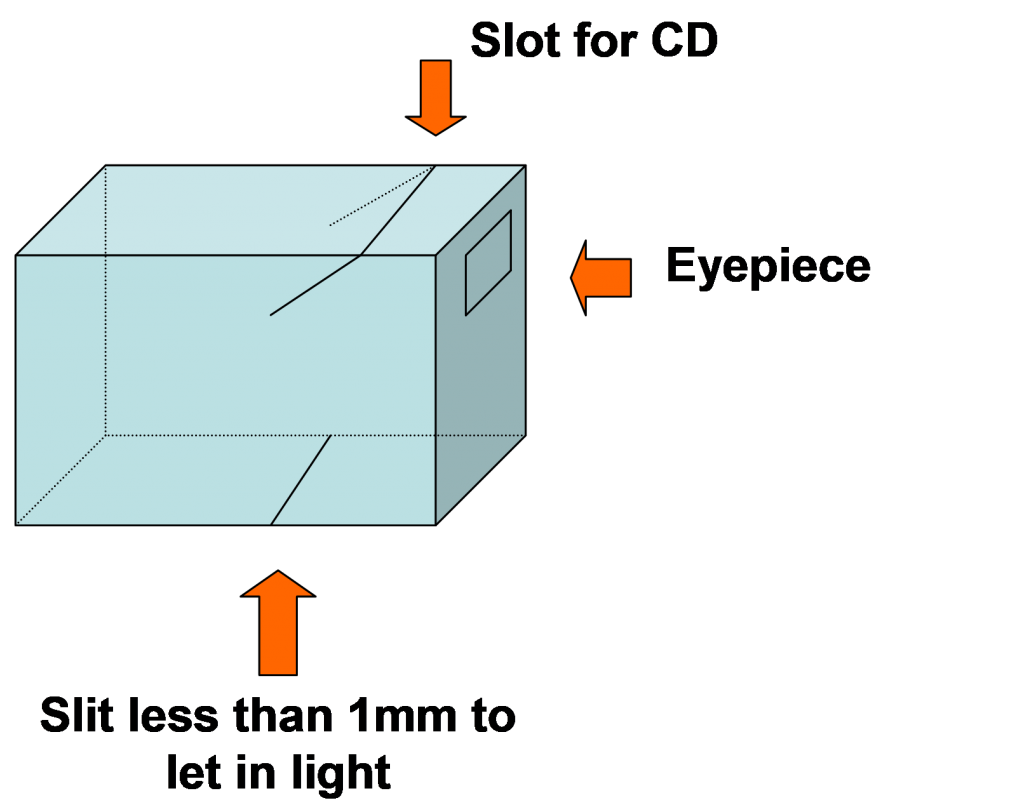
Summary exercises
Next, the students can take their spectrometers and look at the sky *BUT NOT DIRECTLY AT THE SUN!* (or they can cause permanent damage to their eyes). It is easiest to point the spectrometer at a cloud. They should see that the Sun’s light is made up of all the colours in the rainbow but also has many black lines in it, like below.
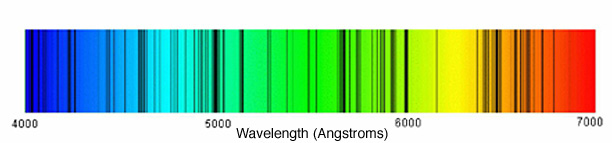
The dark lines are called the Frauenhofer lines and are caused by atoms in the solar atmosphere absorbing light emitted from the surface, blocking it from reaching the Earth. Each element has a distinct “fingerprint” of lines by which it can be identified. So, atoms of a particular element absorb light of a very specific wavelengths. The element Helium was discovered in the Sun’s atmosphere (the name coming from the Greek word for the Sun helios.
Next, the students can use their spectrometer to look at the light coming from a fluorescent light. Instead of a full rainbow, they should see only a few lines. Each line corresponds to a different element, so the exact spectrum you see depends on what kind of light you have. Most likely you have one that looks like this…
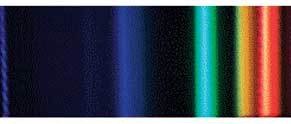
The brightest peaks are in the green and the orange. By measuring the exact wavelength of these peaks, we can work out which elements are giving off the light. In this case, the green line is given off by mercury, and the orange is given off by an element called Europium (look for it on the periodic table, symbol: Eu, atomic number: 63, it’s one of the lanthanides.)
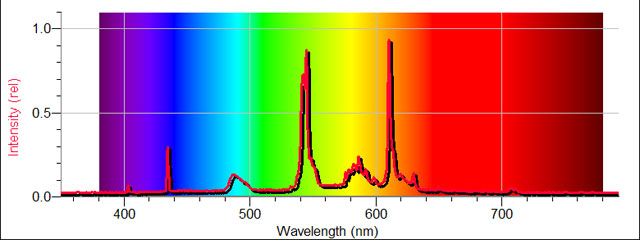
Thursday April 16, 2020 – Build a Rubber Band-Powered Car
Courtesy of https://www.sciencebuddies.org

Introduction
Admit it, you’ve probably launched a rubber band at least once—pulled one end back, and let it go flying. Did you ever suspect that rubber bands could also be a fun way to learn about physics and engineering? Find out in this project where you’ll build a rubber band-powered car.
Credits
Ben Finio, PhD, Science Buddies
Materials
- Note: this is an engineering design project. The following is a suggested list of materials, but you can substitute different ones.
- Corrugated cardboard
- Two drinking straws
- Two wooden skewers
- Four CDs (that are okay to get scratched)
- Sponge
- Paper clip
- Assorted rubber bands
- Tape
- Scissors
- Flat, hard surface for testing your car
- Hot-glue gun (optional)
- An adult
Procedure
- There is more than one way to build a car! Watch this video for a general overview of how to build different types of cars, including a rubber band car. You can follow the specific steps below to build your car, or modify them using your own ideas.
2. Refer to this picture for guidance as you build your car:
3. Carefully cut a piece of corrugated cardboard that is slightly longer and wider than the length of one straw.
4. Tape the two straws to the cardboard, parallel to each other, one at each end.
5. Cut a rectangular notch in the cardboard on one end, about one inch by one inch. This will also cut a segment out of the middle of one of the straws.
6. Insert a wooden skewer through each straw. These will be your car’s axles.
7. Cut four small squares from the sponge and carefully press them onto the ends of the skewers.
8. Attach CDs to the axles to form wheels. Do this by stuffing a piece of sponge into the hole in the middle of the CD, then using tape to secure the CD and prevent it from wobbling.
9. Make sure your car can roll smoothly. Put it down on a flat surface and give it a push. If necessary, adjust the wheels so they are all parallel and don’t wobble.
10. Loop a rubber band through itself around the middle, exposed part of the wooden skewer (where you cut out a notch in the cardboard and straw).
11. Tape the rubber band to the skewer to prevent it from slipping—when the skewer rotates, the rubber band should rotate with it.
12. Cut a small slot in the middle of the piece of cardboard.
13. Hook a paper clip through the slot.
14. Hook the free end of the rubber band onto the paper clip.
15. Wind up the axle that’s connected to the rubber band. If necessary, pinch the rubber band on the axle when you start, to prevent it from slipping.

16. Put your car down and release the axle.
17. If your car didn’t move, it’s time for some troubleshooting.
- If the rubber band didn’t unwind at all, wind it more tightly and try again. You can also try changing the location of the slot for the paper clip to adjust the rubber band’s tightness.
- If the rubber band unwound but the axle didn’t spin, then the rubber band might not have been attached securely enough to the skewer. Try attaching it to the skewer by tying a tight knot or using hot glue.
- If the wheels spun but the car didn’t move forward at all, there might not have been enough friction between the CDs and the ground. Try using the car on a different surface. If that still doesn’t work, try giving your CDs more grip by stretching rubber bands around them or by putting a bead of hot glue along the edges. (Let the glue dry completely before you test your car again.)
18. Keep experimenting with your car. Make small changes to the design and test it again. How far can you get the car to go?
What Happened?
When you wind up the car’s axle you stretch the rubber band and store potential energy. When you release it the rubber band starts to unwind, and the potential energy is converted to kinetic energy as the car is propelled forward. The more you stretch the rubber band, the more potential energy is stored, and the farther and faster the car should go.
That all sounds great in theory—but in practice you might have found it difficult. Several things can prevent your car from working well. If the wheels are not aligned properly, they can wobble or jam and prevent the car from rolling smoothly. The rubber band can slip relative to the wooden axle, preventing the wheels from spinning. Even if the wheels do spin, there might not be enough friction with the ground, causing them to spin in place without moving the car. These are all challenges you can overcome with a little engineering effort!
Digging Deeper
When you stretch a rubber band it stores potential energy. Specifically it stores elastic potential energy—the type of energy stored when a material is deformed (as opposed to gravitational potential energy, the type you get when you raise an object off the ground). When you release it all, that stored energy has to go somewhere. If you launch a rubber band across the room, the potential energy is converted to kinetic energy, the energy of motion.
But what about putting all that stored energy to use? You can attach your rubber band to a simple machine—a wheel and axle—to build a simple rubber band-powered car. In real cars, gasoline’s chemical energy or the electrical energy in a battery is converted to kinetic energy of the moving car. Your model car used a rubber band as the source of energy.
For Further Exploration
- Test different types of rubber bands to power your car. Does it work better with long or short ones? Thick or thin ones?
- Try using different materials to build your car. What happens if you use bottle caps instead of CDs for wheels or pencils instead of skewers for axles?
- Do this project with friends or family. Everyone can build their own car and then see whose can go the farthest.
Wednesday April 15, 2020 – Build a Hand Crank Winch
Courtesy of https://littlebinsforlittlehands.com/
If you are like me, then you have a big container of recycled materials and cool items you can’t bear to get rid of! That’s exactly how we built this hand crank winch. Using recycled items for STEM projects is an awesome way to re-use and re-purpose common items you would normally recycle or throw away. This simple machine for kids is a fun STEM activity to try!
HOW TO BUILD A HAND CRANK WINCH!
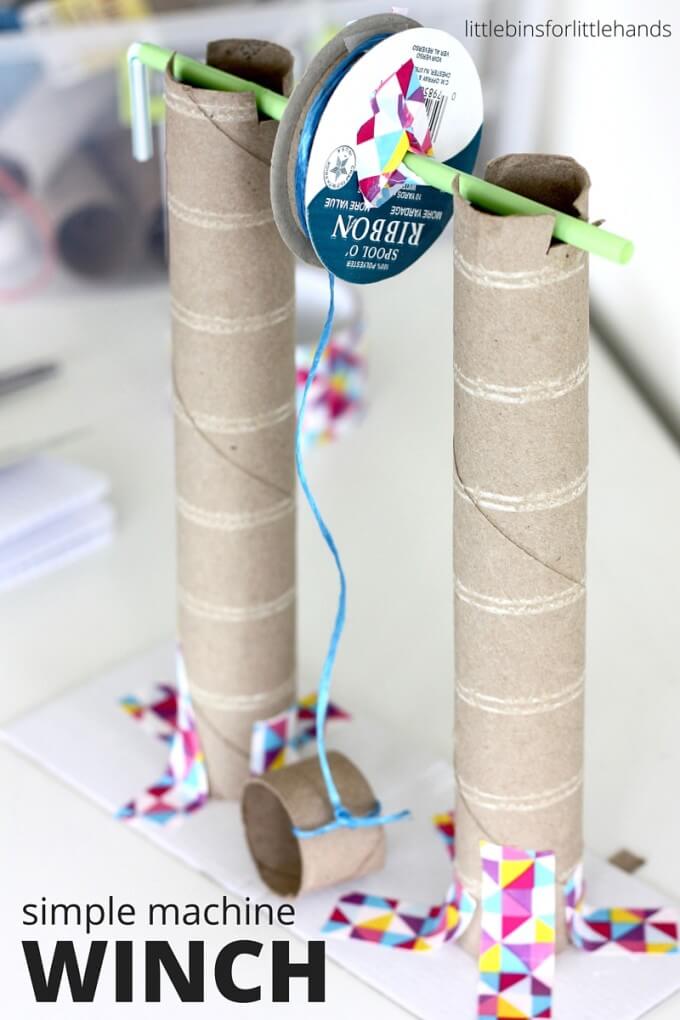
SIMPLE MACHINES FOR KIDS
Building simple machines with kids is a great way to show them how stuff works! Our winch craft is truly an easy STEM activity with big impact.
Using recycled items to make cool things allows awesome STEM challenges to be accessible to ALL kids! Plus any activity that uses recycled materials is great for the environment!
YOU WILL NEED:
- Cardboard Tubes
- Spool {can be optional, see below}
- Straw or Pencil
- String
- Tape, Scissors
- Small Basket {object to attach to string}
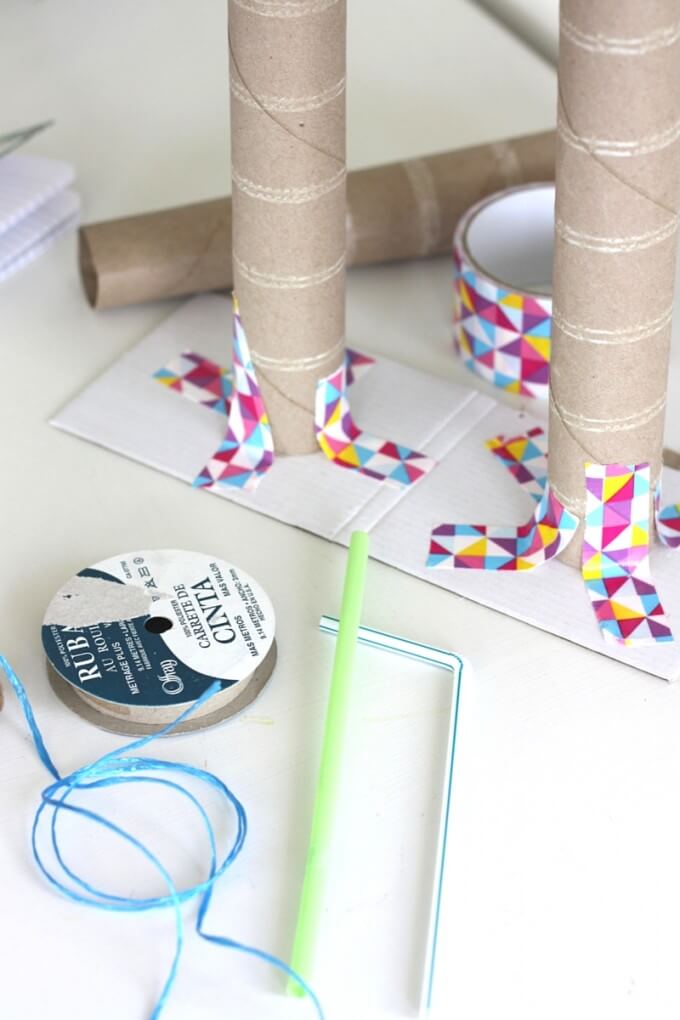
Here’s the picture diagram of the four major steps to building this winch simple machine. I will describe the steps below the picture.

STEP 1
Tape 2 cardboard tubes to a solid surface. Use your straw as a reference tool for how far apart they should be placed from each other.
STEP 2
Make 2 cuts at the top of each cardboard tube just big enough of the straw or pencil to rest and be able to spin.
STEP 3
Put your spool on the straw or pencil. Now if you don’t have a spool, you can simply secure your rope to the straw or pencil with a piece of tape. You still have a hand crank winch! If you do use a spool make sure to secure it with tape to the straw or pencil. What if you don’t secure it? The spool just spins around the straw and there is no ending up of string! We learned this concept with our rubber band car too!
If you are using a straw, you can even thread another straw into it and use the bendy part to make a handle!
STEP 4
Secure your rope or string to spool with a piece of tape {or to straw directly if you don’t have a spool} and tie your basket or object to the bottom of the string.
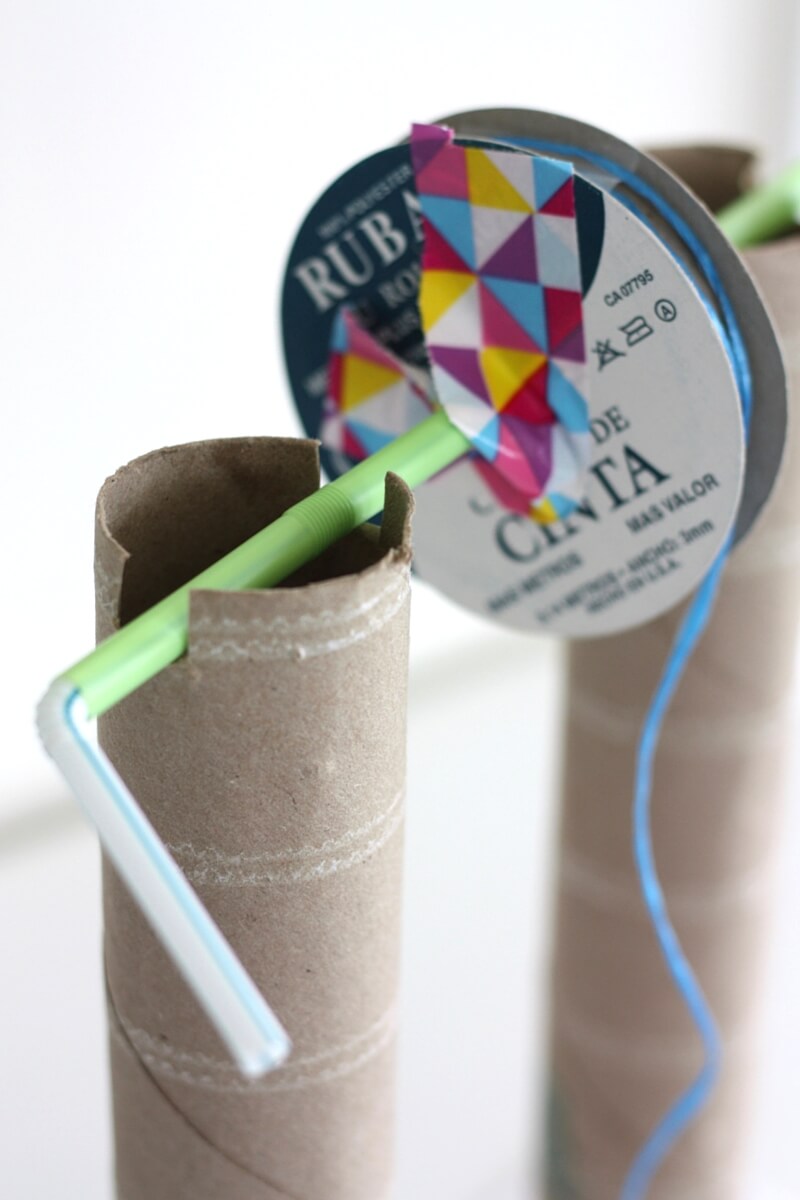
Go ahead and test out your hand crank winch simple machine. What can you pull up with it? Do you think it makes lifting heavy things easier. Another great idea is to test out a pulley simple machine!

A simple machine such as this winch is used to raise and lower weight. An example of a winch that is pretty easy to get a picture of is a bucket in a well!
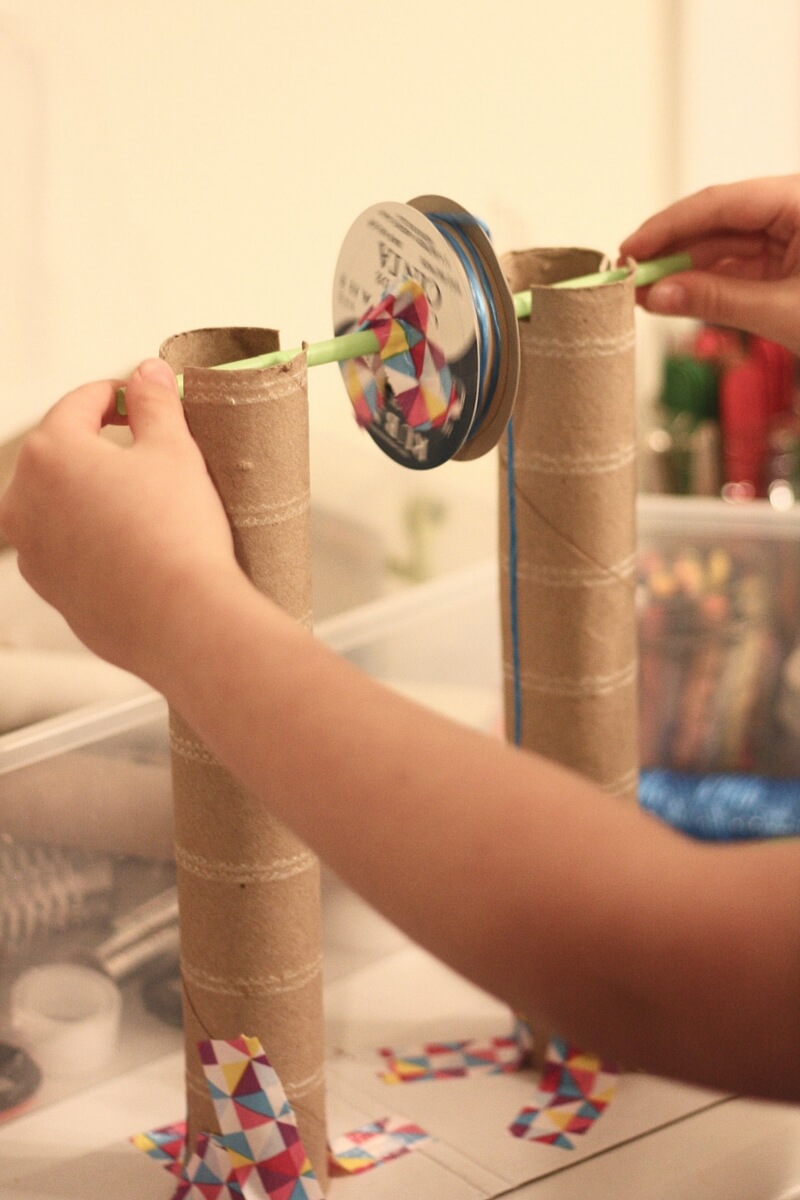
Building simple machines with kids is tons of fun and gives them a great chance to troubleshoot problems and come up with creative solutions. Raid the recycling bin to make your simple machines this year. Building machines makes an awesome STEM challenge for a variety of age groups too.
Tuesday April 14, 2020 – Phases of the Moon
Courtesy of https://learning-center.homesciencetools.com
Unlike the sun, the moon does not give off its own light; instead, it reflects the sun’s light. Because of the orbit of the moon, we don’t always see the whole moon illuminated. How much of the moon we see depends on the phase it is in. Over the course of a month, you can observe all the different phases. A great way to teach your children about this is to observe the moon every few nights and discuss which phase it is in. If you have binoculars or a telescope, be sure to use them in your observation! During the month, what other changes do you notice? Does the moon always appear to have the same color and size? Your kids might enjoy keeping a journal with sketches and observations of each stage.
There are eight main phases in the moon’s monthly cycle:
New Moon– the sun, moon, and earth are lined up, with the sun’s light reflecting off the side of the moon facing it. To the earth on the other side of it, the moon appears to be very dark at this stage.
Waxing Crescent– the stage between the new moon and first quarter; a sliver of brightness is visible on the right. The dark part of the moon is still what is most visible to Earth at this point.
First Quarter – the moon is to the left of the earth and sun (moving counter-clockwise); the sun’s rays shine on the half of the moon facing it, half of which is visible to Earth. Thus, it appears to be a ‘half-moon,’ half bright and half dark.
Waxing Gibbous – the stage between the first quarter and full moon, when most of the bright side is visible.
Full– the sun, earth, and moon are lined up, with the side of the moon facing the earth illuminated.
Waning Gibbous – occurs after the full moon; the right edge appears to be dark or invisible. The moon is in the position opposite where it is during its waxing gibbous stage.
Last (Third) Quarter – the moon is to the right of the earth and sun; because the sun’s light only falls on the side of the moon facing it, there also appears to be a ‘half-moon’ in this phase. The side that is bright is now opposite where it was during the first quarter since the moon is on the other side of Earth.
Waning Crescent – occurs between the last quarter and the new moon; only a crescent of the bright sideshows, on the left edge closest to the sun. The rest of the moon facing us is the ‘dark’ side.
Showing Moon Phases
What You Need:
- An orange (or a Styrofoam ball of a size similar to an orange)
- A pencil
- A desk lamp (or any lamp with a removable shade)
- A room that can easily be made dark
- An adult’s help
What You Do:
- Get an adult to help you push the sharp end of a pencil halfway through the orange; push it far enough to keep it stable when you hold the unsharpened end.
- Find a room that you can make dark by turning off the lights and closing shades. If you can’t make it dark enough, do the experiment when it is dark outside or use blankets to cover windows.
- Set the lamp on a table or dresser so it is about the same level as your head when you’re standing. Turn the lamp on and remove the shade or turn the lamp so that the bulb is facing toward you (if you’re using a desk lamp).
- Stand about 3 feet in front of the lamp and hold the pencil with the orange attached to it out at arm’s length. The orange should be between you and the lamp. For this activity, you represent Earth, the lamp is the sun, and the orange is the moon.
- To see the moon’s phases, slowly turn your whole body to the left, keeping your arm straight out in front of you with the orange at eye level. This is how the moon orbits the Earth. Keep turning in the same direction until you have gone in a full circle and are facing the lamp again. Keep your eyes on the orange and watch the shadows on it very carefully to see the phases of the moon as we see them from Earth.
What Happened:
It takes around 29 days for the moon to orbit the Earth once and the same amount of time for the moon to spin around one complete time on its axis. That means that we always see the same side of the Moon! However, we do see the moon changing as it goes through its phases.

While facing the lamp (sun), the surface of the orange (moon) facing you (Earth) was dark, even though the other half of the orange, facing toward the lamp was bright. This is the first phase of the moon, called new moon. We can’t see the moon at all during this phase!

As you began to turn away from the lamp, a shadow still covered most of the orange, but you probably saw a small crescent shape of light on the right side of the orange. This phase is called waxing crescent.

The next phase is called the first quarter: the light (sun) shone on the half of the orange (moon) facing it. From Earth, we see half of the light side and half of the dark side during this phase so sometimes it is called a “half moon.”

As you continued to turn to the left, the light shone on more of the side of the orange you could see, lighting up all of the orange except for a small crescent. This is the waxing gibbous phase.

Once you had turned halfway around so that the lamp was directly behind you, the light (sun) shone directly on the orange (moon) making the whole side facing you bright. This is a full moon. During a full moon, the side facing away from Earth is dark. This phase is the exact opposite of new moon.
(Note: if the orange isn’t fully illuminated, try moving your head or shoulders so you aren’t blocking the lamp. If you are blocking it, you’ve created a lunar eclipse – which happens when the Earth blocks the sun’s light from hitting the moon. Normally, the moon is just above or just below Earth so an eclipse doesn’t happen every time there is a full moon.)

At this point, the amount of the light side of the moon that we can see begins to decrease, or wane. The next phase is called waning gibbous. Most of the moon is still light during this phase.

Next is the last quarter (also called third quarter) where only half of the illuminated side of the moon is visible. This phase is opposite of first quarter. Notice that your back is facing toward the direction you were facing when you saw the first quarter phase!

The last visible phase is the waning crescent, where only a sliver of light is visible. This phase is opposite the waxing crescent. After this, you will be facing toward the lamp (sun) again, and the orange (moon) will be back to the new moon phase!
If you’re having difficulty remembering the difference between waxing and waning moon phases, these rhymes might help:
Waxing: “Moon on the right, getting bigger every night.” (Leading to a full moon.)
Waning: “When the moon is waning, it is fading to the left until there’s no moon remaining.” (Leading to a new moon.)
Thursday April 9, 2020 – How to Make a Sundial
Courtesy of https://learning-center.homesciencetools.com
This project demonstrates that the Earth is rotating, in relation to the sun, by showing how a shadow moves throughout the day. Kids will see that by marking the places the shadow moves, they can create their own sundial to tell time outside. Read the lesson on How We Tell Time Using the Sun for more information.
What You Need:
- Stiff piece of cardboard, file folder, tablet back, or other flat, durable surface to make marks on
- Pencil or Chalk
- Ruler or yardstick
- Colored drinking straw, or other long, narrow object
- Clay, tape, or other adhesive to adhere the object to the flat surface
- Masking tape
- Small scissors (Have an adult supervise the use of any sharp objects!)
- Marker, pen, or pencil
- Magnetic compass
- Watch or clock
- Timer, alarm, or stopwatch to alert you at one-hour intervals
What You Do:
- Choose one of the long sides of your cardboard to be the bottom. Two inches from the bottom, make a pencil mark in the center.
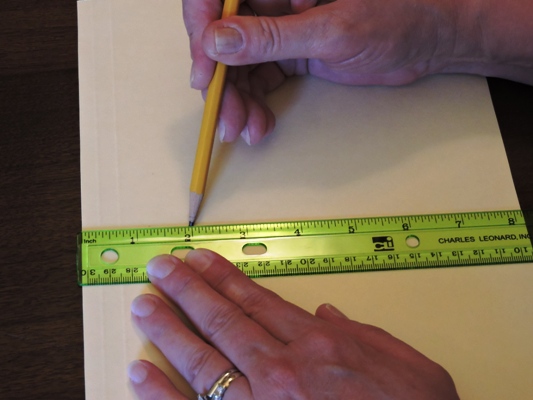
2. Use a pencil, small scissors, or other sharp object to make a small hole the same size, or slightly smaller than, the straw.
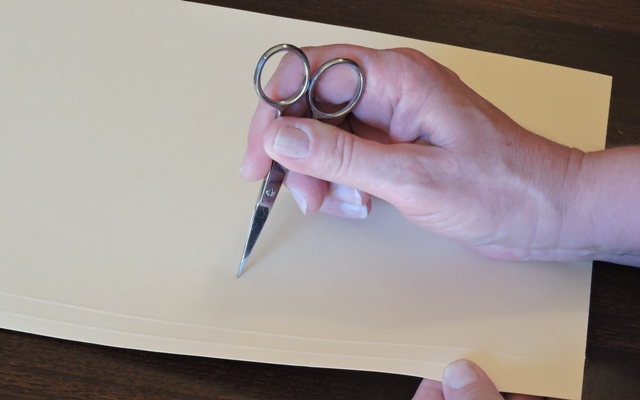
3. Use the scissors to cut the straw: make three vertical, equal, half-inch cuts from the bottom of the straw so that you can spread the sections out flat, for the straw to stand on. If you’re using a pencil or other heavier object, skip this step.
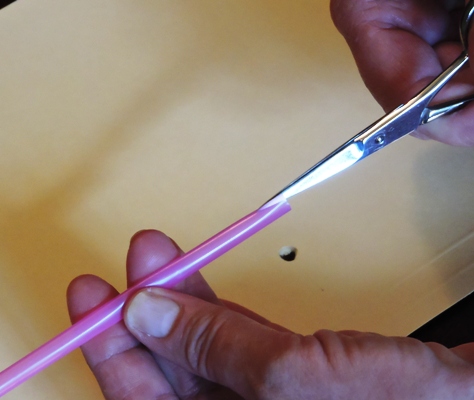
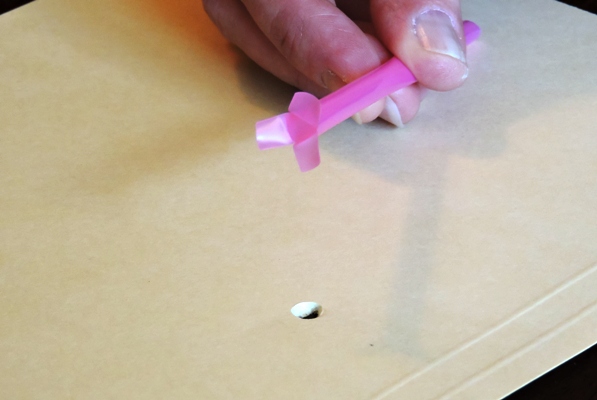
4. Insert the top of the straw through the hole in the cardboard until just the cut sections remain on the bottom of the cardboard.
5. Tape the cut sections securely to the bottom of the cardboard. If you’re using a pencil or other heavier object, use clay on the top of the cardboard (instead of tape on the bottom) to hold your object upright.
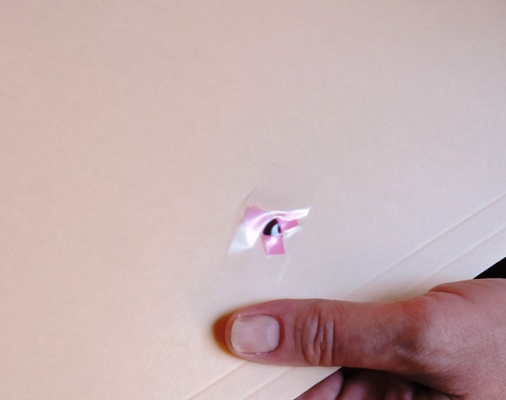
6. Now your straw should be standing upright when you place the cardboard on the ground or table.
7. Find a place where the sun shines all day and you can leave the sundial in the same position. Options include your driveway, the sidewalk, your patio or other hard, flat surface.
8. Find North. Use a compass to find North. Position the cardboard so that the shadow of the straw aligns with North on the compass. Use the masking tape to secure the cardboard to the ground or table.
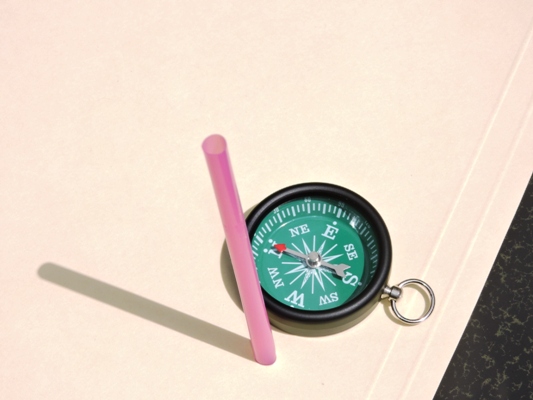
.jpg)
9. Set your alarm for the next top of the hour (noon, 1:00, 2:00, etc.)
When the alarm sounds, observe where the straw’s shadow is on the cardboard. Align the ruler with the edge of the straw’s shadow and make a pencil mark along the edge of the ruler.
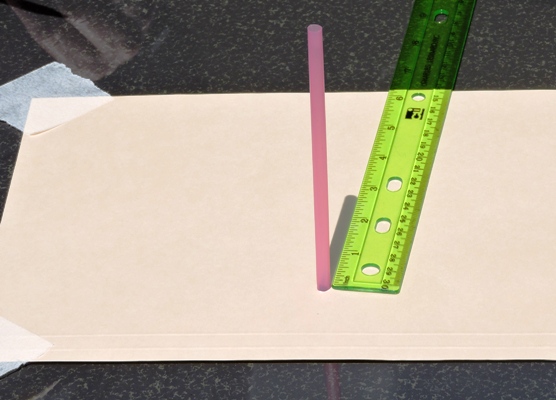
10. Write the hour next to, on top of, or underneath, the mark.
11. Repeat the observation and notes at each hour. If you started in the afternoon, come back to the sundial the next day in the morning hours to complete the hour marks.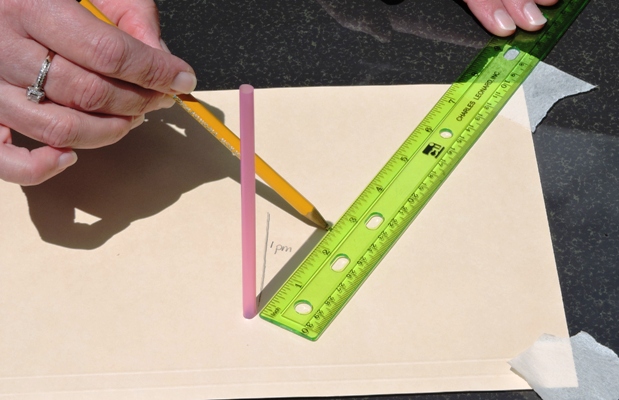
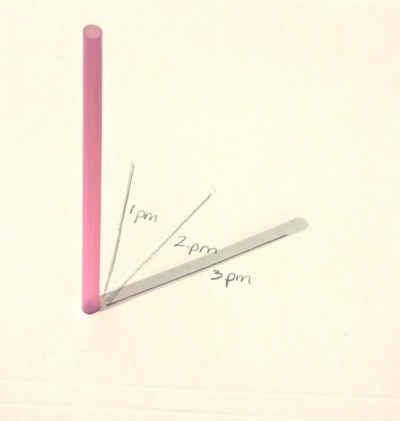
What Happened:
As the day went by, the Earth spun on its axis, so the rays from the sun reached your sundial from different angles, making the straw cast a shadow in different places. By marking the shadow at equal segments of time, and assigning a number to each segment, you’ve made your first sundial!
This sundial is accurate for your location and time of year. When the Earth moves around the sun and the sun’s rays reach you differently, this sundial won’t be accurate.
Wednesday April 8, 2020 – Commercial Crew A to Z Activity and Coloring Booklet
Courtesy of https://www.nasa.gov/stem-ed-resources
Grade Levels: K-4
Subjects: Living and Working in Space
Download this printable coloring, writing and activity book. Work puzzles and learn new words about NASA’s Commercial Crew Program that will launch astronauts to space on American rockets.
Commercial Crew A to Z Activity and Coloring Booklet
Tuesday April 7, 2020 – De-Coding Starlight Activity: From Pixels to Images
Courtesy of https://stem-works.com
This activity is a little more advanced and is designed for kids in grades 5-8.
Download the level one/middle school handout.
The Scenario
You have just discovered a brilliant new supernova remnant using NASA’s Chandra X-ray Observatory. The Director of NASA Deep Space Research has requested a report of your results in her office in 45 minutes. Unfortunately, your computer crashed fatally while you were creating an image of the supernova remnant from the numerical data and you also lost a small amount of back up data. To fix the situation you will create, by hand, an image of the supernova remnant.
To do so, you will use raw (or unprocessed) data from the Chandra satellite. Additionally, you will prepare a written explanation of your discovery and answer a few of the Director’s questions.
Parent/Educators: Activity Background & Webinar
Monday April 6, 2020 – Making Moon Craters with Moon Dough
Courtesy of https://littlebinsforlittlehands.com
Kids want to explore places like space, and especially the moon! The astronauts of Apollo 11 landed on the moon on July 20, 1969. I bet they encountered a few moon craters, also known as lunar craters or impact craters. There is even a moon crater named Apollo. To celebrate the moon landing anniversary, why not try this moon crater activity with our easy moon dough recipe. Combine with a children’s book about the moon and you add literacy into the learning too! Moon activities are the perfect way to explore space.
Making Moon Craters with DIY Moon Dough
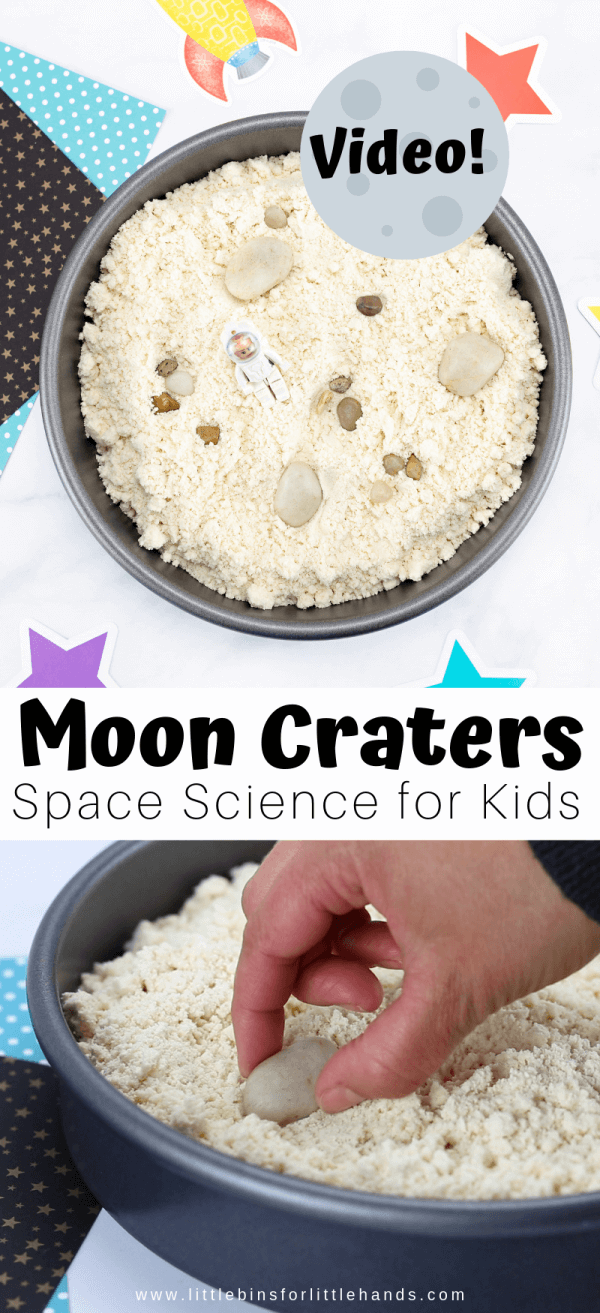
Video can be found on the source page here: https://littlebinsforlittlehands.com/moon-dough/?jwsource=em
Learn About Making Craters
Get ready to add this simple making moon craters activity to your space theme lesson plans this season. If you want to explore how moon craters are formed, let’s get started making this sensory moon dough mixture!
Head to the kitchen, open the pantry and grab these simple supplies to whip up your moon dough mixture.
This moon craters activity ask the question: What are craters and how do they form on the moon? Read below to learn more.
You Will Need:
- 4 cups of baking flour
- 1/2 cup of cooking oil
- Small rocks, marbles, or other weighted objects (for making craters)
- Astronaut figure (for sensory play after the crater making activity)
- Round baking pan (any shape will do but a circular one gives it a moon shape look.
How to Make Moon Dough:
STEP 1: Add 4 cups or so of any baking flour to a bowl. This can be made gluten-free if necessary with gluten-free flour mixture.

STEP 2: Add a 1/2 cup of cooking oil to the flour and mix! Essentially you are making cloud dough.
TIP: The mixture should be moldable or packable.

STEP 3: Add the mixture to your circular “moon” shaped pan! Get your objects ready for making moon craters. You can lightly smooth out the surface of the mixture too, so your craters are more visible.

STEP 4: Making craters is simple and fun. Read more about craters below. To explore moon craters, have your kids drop a variety of weighted objects onto the surface as seen below).

Slowly and carefully remove the object and examine the crater.
Think about it: Does dropping different weighted objects from different heights make a difference in the shape or depth of the crater?

STEP 5: Make sure to enjoy the tactile sensory play aspect of the activity too. Cloud dough or moon dough is perfect for hands-on play!

MOON DOUGH TIPS FOR HOME OR IN THE CLASSROOM
This is a super easy mixture to whip up and can be considered taste-safe since the only two ingredients are flour and oil. You can choose to use baby oil to make your moon dough but it will not be a taste-safe dough anymore!
Store your moon dough in a covered container. If the mixture feels dry and is no longer moldable, mix in a touch more oil until you achieve the desired consistency.
Check your moon dough for freshness before re-using. This mixture will not last forever!
Moon Dough Tips for Home
This is a super easy mixture to whip up and can be considered taste-safe since the only two ingredients are flour and oil. You can choose to use baby oil to make your moon dough but it will not be a taste-safe dough anymore!
Store your moon dough in a covered container. If the mixture feels dry and is no longer moldable, mix in a touch more oil until you achieve the desired consistency.
Check your moon dough for freshness before re-using. This mixture will not last forever!
As always, sensory play can get a bit messy especially if you are dropping rocks into it! You can easily put down a dollar store shower curtain under the pan or take the activity outside. A kid-friendly broom and dustpan allow kids to feel successful with cleaning up small spills.
What Are Moon Craters and How Are They Formed?
Is the moon made of cheese, swiss cheese to be exact because of all of the holes? Those holes aren’t cheese, they are in fact moon craters!
The South Pole-Aitken Basin is the largest, most well-known crater on the moon along with others called Tycho, Maria, and even Apollo!
Craters are formed on the lunar surface so they are called lunar craters or impact craters. The craters are made from asteroids or meteorites that collide with the lunar surface just like the rocks or marbles in the moon sand you made!
There are thousands of craters on the moon surface and you can learn more about them here. The moon does not have the same atmosphere as we do here on earth, so it is not protected from asteroids or meteorites hitting the surface.
Some characteristics of a crater include loose material that is scattered around the outside of the depression, a rim around the perimeter, a mostly flat crater floor, and sloped crater walls.
We do still have craters here on earth but water and plant life cover them better. The moon does not have much going on in terms of erosion such as rain or wind or even volcanic activity to change the appearance or camouflage the craters.
Just like the craters you might have made in your moon dough, not all will have the same depth or diameter. Some of the largest craters in circumference are considered pretty shallow at 15,000 feet deep whereas some newer craters are over 12 miles deep but smaller in the distance around!
Friday April 3, 2020 – Make a Stethoscope
Courtesy of http://www.sciencekids.co.nz
Make your own stethoscope and check your heart rate before comparing it to others. You might not be a real doctor but you can still use some of their medical equipment as part of this fun science project.
Check Your Heart Rate
What you’ll need:

- A balloon
- A piece of tubing
- 2 small funnels
- Scissors
- A timer
- Rubber band (optional)
- A calculator (optional)
Instructions:
- Take the piece of tubing and fit a funnel to each end.
- Stretch the balloon by blowing it up and then letting the air out.
- Cut off the top third of the balloon with scissors.
- Stretch the top third of the balloon tightly over the open end of one the funnels. If necessary, use a rubber band to hold it in place.
Making your stethoscope work:
- Find your heart with your hand by feeling where it beats in your chest.
- Sit down somewhere quiet and place the end of the funnel with the balloon over it against your chest, directly onto your skin, just to the left centre.
- Hold the other funnel to your ear. You should hear a low beating sound.
- Use the timer to count how many beats you hear in 20 seconds. Multiply this number by three (use a calculator if you’re not confident) to find out how fast your heart beats in one minute.
- Try doing some more tests such as running around for 5 minutes and then checking how fast your heart is beating. Compare your results to your brothers, sisters, parents and even pets heart rates, are there any differences?
What’s happening?
Did you know that when a doctor listens to your heartbeat with a stethoscope, they are actually listening for two sounds? The first sound is a longer, lower pitched sound. The second is a shorter, higher pitched sound.
The lower pitched sound is made by the closing of two heart valves when blood is flowing out of the heart. The higher pitched sound is made by two other valves when blood is flowing into the heart. When a person exercises or participates in any kind of physical activity, the heart beats faster in order to pump more blood and oxygen to the muscles that are being used. The closing of the heart valves makes a sound which causes the stretched balloon to vibrate. The vibrating balloon makes the air in the tube vibrate and the tube then carries these sound vibrations to your ear.
Thursday April 2, 2020 – Using Printable Star Charts With Kids
Courtesy of https://kids.lovetoknow.com
Children are naturally interested in astronomy, especially the celestial bodies that appear with unfailing regularity. Printable star charts, which are pictorial representations of the night sky, can come in handy while introducing stars and constellations to children. In essence, star charts for kids are like a map, so it helps children identify the stars.

What Do You See on a Printable Star Chart?
A star chart lets you see the whole starry sky at a glance. It allows you to relate positions of constellations with each other and can help you identify common stars and constellations. Depending on the detail, it may also help you see other celestial bodies in the night sky.
Brightness of the Stars
The stars are depicted in the star chart as different-sized dots, their size depending on how bright they appear in the sky, (not how large they are). The size of the dot on a star chart corresponds to the brightness of the star only. A star that is smaller than the others around it may appear brighter in comparison if it is closer to earth. A giant star may be just a tiny dot in the chart if it looks small in the sky due to its greater distance from our planet. Children should be made aware of this fact.
Constellations and Position of Stars
Star charts may show groups of stars as constellations too, marking their outlines with dots representing the stars, and with lines connecting them. However, children should be taught that the constellations are not natural groupings occurring in nature, but rather were identified as groups by ancient astronomers. They gave names to these groups according to the shapes of objects they seemed to resemble. It may take quite a bit of imagination to relate the outlines of the constellations to the shapes they are supposed to represent. When learning about constellations for kids, printables like a star wheel or chart can be helpful.
Tips on Using a Star Chart
While star charts are not difficult to use, there are a few tricks to the trade that will help you and your child identify the most constellations. Using a constellations map for kids such as a star wheel can be a helpful visual tool.
- Use the chart on a clear night where there are no clouds and not a lot of light.
- It is easier to identify constellations if you hold the chart above your head.
- It’s best if you can find a constellation in the sky that you are familiar with and then use the map to find nearby constellations. For example, if you see the Big Dipper in the sky, find the Big Dipper on your map, and then find a nearby constellation in your map. Follow the map in your hands in the sky to find your next constellation.
- Make sure you know what direction you are facing.
- Have your kids observe the sky over several months and note how the positions of constellations change. You can do this either by watching the constellations from the same spot every time you go stargazing or looking at a single constellation over several months.
- Star charts are designed to be used with the naked eye. A telescope may come in handy but is not necessary to learn the positions of the constellations.
Printable Star Wheel
To use the printable star wheel, or planisphere, below, you will need Adobe Reader. Click on the chart to view the star wheel, download it and print it. If you run into any problems printing the chart, the Adobe Guide can help. There is both a wheel for the northern and southern hemisphere. Note that the sky is going to be distorted the further away you are from the latitude noted on the chart, however, it should be close enough to follow throughout most of the northern and southern hemispheres, respectively.

Educational Star Chart Activities for Kids
Kids can enjoy countless nights of fun simply staring at the night sky or looking for constellations with their star chart. However, you can also use it as an educational tool at home, for school family nights, at summer camps, and space camps. Kids under age nine will need more help using the chart and with these constellation activities. Kids ages ten and up can use their skills in following directions to figure it out on their own.
Spot the Star Differences
If you look at the different star wheels, you’ll see that the same constellation is closer to a different month or date on each one. Kids can spot these differences in an individual activity or as a competition with others.
- Choose one of the North America star wheels and the South America star wheel for each child and set them in front of the child so both are oriented the same way. For example, November is at the top of both circles.
- Kids can write down the differences they see between the two wheels. Perhaps a constellation is closest to March on one and September on another. Do they all have the same names on all star charts?
- Once they spot the differences, kids can then suggest why they might be different.
Track Constellations
The star wheel chart tracks the night sky from 6 p.m. to 6 a.m. on any given day and kids can track it too.
- Cut a piece of clear plastic, like what you use as a document sleeve, to fit over the wheel that’s closest to your location.
- Allow three to four hours for kids to see how the sky changes over time as the Earth is tilting.
- To start, children should look for an easy constellation like the Big Dipper or Little Dipper and plot it on their plastic-coated star wheel. It may be in the exact position noted on the wheel or it may be slightly off.
- Over the next 10 to 15 minutes they should plot as many of the other constellations as they can find.
- After about an hour, kids can re-plot the same constellations they noted before.
- For each hour of observation, kids can write down where these same constellations are positioned.
- Start a discussion about why some positions changed and why one or more stars may have stayed in the exact same spot.
What I See Star Wheel
Kids create their own star wheel using their imagination and the sky above in this creative activity.
- Cut out a blank star wheel on a piece of white paper.
- After the blank star wheel is inserted into the cover, kids should write the date on the wheel and line it up with the time.
- As they stare at the night sky, kids can plot constellations they see with their imagination on the wheel.
- Kids can then trade wheels with a friend and see if they can spot their creative constellations.
Follow the Constellation Path
Most constellations on a star chart contain straight lines. Follow the end line of a constellation then go past it with your eyes to see if you can bump into the next one that extends from that line.
- Set up your star chart then choose one constellation to start with.
- Find the constellation’s start and end.
- Choose one end of the constellation and visualize past where it ends, continuing in a straight line, until you run into another constellation with your eyes.
- Use a pencil to connect the constellations on your star chart.
- Continue until you don’t run into another constellation.
- Take a look back at the path you traveled across the sky.
Starry Sky Relay
Most kids love a little competition and it’s easy to turn star gazing into an educational relay. You can play this game with your family or any size group of kids.
- Separate players into equal teams. Select a few constellations for kids to find and share them.
- The first task for each team is to assemble the star chart.
- When that is complete the player tags the next person on her team. This person has to set the chart correctly.
- The next player then searches for one of the named constellations. When they find it, they hand off the chart to the next player.
- The rest of the players take turns looking for the remaining constellations.
- The first team to complete the entire challenge wins.
What Time Is It Mr. Sky?
Challenge older kids to deduce what time you’re thinking of based on clues given about what you see in the night sky.
- Give each child their own star chart.
- Call out a direction, a date, and the location of a specific constellation.
- Kids then use their star chart to tell you what time it is.
Benefits of Star Gazing for Children
It is exciting for children to learn the names of the prominent stars in the sky and to be able to identify them. Once they learn to locate the different constellations, they can compare their relative sizes by measuring the angular distance from earth and learn to identify the cardinal directions as ancient mariners did before the invention of the compass. They can also see how different months get Zodiac signs assigned to them. A couple of great lessons on stargazing can be a lifelong memory that demystifies the night sky and brings kids closer to nature. Stargazing is a wonderful family activity that everyone can enjoy.
Wednesday April 1, 2020 – Balloon Magic with Bernoulli’s Principle
Courtesy of https://www.sciencebuddies.org
Have you ever seen pictures or videos of a roof being blown off a house during a hurricane or tornado? You might be surprised to hear that the roof is actually not pushed off by the strong winds but instead by the air inside the house! This can be explained by Bernoulli’s principle, which states that fast-moving fluids or air, such as strong winds, have lower pressure than slow-moving air. In this activity you will demonstrate how balloons can be moved in a similar way. It is not quite as impressive as blowing the roof of a house, but still pretty magical!
Materials:
- Two balloons of the same size
- String (about 60 cm length)
- Scissors
- Tape
- A door frame
- Paper towel tube
- An adult

Prep Work:
1. Inflate both balloons and tie them off at their ends. Both balloons should approximately have the same size.

2. Cut two pieces of string, each about 30 cm in length.
3. Tie the end of one string to one of the balloons.

4. Tie the end of the other string to the second balloon.
5. Use tape to attach the loose end of each of the strings to the underside of a door frame. Space both balloons so that there is a gap of about 10-15 cm between them.

6. Make sure to keep the balloons away from significant air flow.
Procedure:
1. Step in front of the balloons and hold the paper towel tube so that you can blow air into the space between the two balloons.
What do you expect to happen to the balloons if you blow air in between them?

2. Make sure that the balloons are still. Then blow into the paper towel tube very slowly. Try to produce a steady air flow.
What do you notice? Are the balloons moving?
3. If the balloons moved, stop their movement and then blow in between them again using the paper towel tube. This time try to blow through the tube harder than before but still try to maintain a steady air flow.
What happens to the balloons this time? Can you explain your observations
4. Finally, repeat step 3, but this time blow through the tube as hard as you can, producing a steady air flow.
Do your results change with increasing air flow? Why or why not?
Cleanup:
1. You can reuse all of the materials or dispose of them in the regular trash.
What Happened?
Did you notice that both balloons magically moved towards each other without being touched at all? The effect which you observed is a great demonstration of Bernoulli’s principle. As long as both balloons just dangle from the door frame, the air around them in each direction is static. This means the air exerts the same amount of pressure onto each side of the balloon and both balloons are still. When you slowly blew air in between the balloons, they probably did not move much. This is because a very slow air flow does not greatly change the pressure conditions around the balloons.
However, when you blew through the paper tube more forcefully, you should have noticed that the balloons magically came together. By blowing air forcefully between the balloons, you created an area of low pressure in between the balloons. This is because fast-moving air produces less pressure. The air pressure between the balloons decreased in comparison to the air pressure around the rest of the balloons. Because higher pressure pushes towards lower pressure, the balloons were pushed towards each other. You could have made the same observations using ping pong balls instead of balloons. With heavier objects, however, the generated air pressure difference might not be enough to make them move. The spacing between the balloons matters as well. If the gap between the balloons is too wide, the low air pressure area produced by blowing between them will no longer have an effect.
Digging Deeper
Daniel Bernoulli was a Swiss scientist who in the 18th century studied how fluids behave when they are in motion. When experimenting with fluids flowing through an hour-glass shaped tube, he made a discovery. He realized that fast-moving fluids produce less pressure and slow-moving fluids produce greater pressure. His discovery became known as the Bernoulli principle. It is not only true for fluids but also for air because gases, just like fluids, are able to flow and take on different shapes. A simple demonstration of Bernoulli’s principle requires floating a ping pong ball in a moving stream of air, for example on top of a fan or hairdryer. Why does the ball not fly off the fan? It is because of Bernoulli’s principle. The fast-moving air, which carries the ball into the air, is at a lower pressure than the air surrounding the ball. As the ball is trying to fall off the fan, this surrounding higher-pressure air pushes the ball back into the area of lower pressure above the fan. As a result, the ball stays afloat on top of the fan.
Bernoulli’s principle can also explain how lift is generated under an airplane wing. Airplane wings are designed to let the air flowing over the top move faster than the air flowing underneath. According to Bernoulli, this creates a pressure difference in which the pressure on the surface of the wing is lower than below. This higher-pressure air pushes up on the wing and thus creates an upward lifting force—the airplane takes off!
For Further Exploration
- Repeat the same experiment but vary the size of your paper tube. Do smaller diameter tubes, such as a straw, have the same effect? Do you need the paper tube at all?
- Find out if you can still make the balloons move if they are further apart from each other. Change the distance between both balloons and test if it affects your results. Do you find a maximum or minimum distance beyond which the experiment does not work anymore?
- Instead of balloons, try using ping pong balls or other objects in this experiment. Do you still see the same effect?
Tuesday March 31, 2020 – Build the Best Bridge
Courtesy of https://www.sciencebuddies.org
Bridges come in all shapes, sizes, and materials. What makes a bridge the strongest? Find out in this fun activity as you build simple bridges with paper and test to see how much weight they can hold.
Materials
- Two thick books or small boxes
- Paper
- Tape
- Coins or other small, heavy objects to use as weights (small rocks, nuts and bolts, etc.)

Procedure
- Place your books about 10 inches apart.
- Lay a single piece of paper across the books.
- Place a penny in the middle of the paper. What happens? If the “bridge” does not collapse, try adding more pennies.
- Fold the piece of paper in half lengthwise, and try again. Does the bridge hold more pennies this time?
- Now fold the paper into a “channel” shape. Fold the paper in half lengthwise twice. Then, fold up the edges to form walls. Use tape to hold the edges in place, to prevent the bridge from unfolding.
- Place a penny in the middle of the bridge. One at a time, keep adding pennies along the length of the bridge. This simulates how real cars and people are spread out along the length of a bridge. Do not stack them all on top of each other in the middle.
- If you fill up the whole bridge, start a second layer of pennies. Keep adding pennies until the bridge

8. Experiment with different shapes for your bridge. For example, try changing the number of times you fold the paper in half, the width of the base, or the height of the walls.
What shape makes the strongest bridge?
9. There are many other simple experiments you can do. See the Further Exploration section for some ideas.
What Happened?
You probably found that a single, flat piece of paper could barely support its own weight, let alone any pennies. Folding the paper in half may have made it strong enough to support a few pennies. The more times you folded the paper in half, the stronger it got. Changing the shape of the bridge to give it vertical “walls” made it significantly stronger, and it could probably hold dozens of pennies. While a horizontal piece of paper is very easy to bend in the vertical direction, the vertical wall sections are very difficult to bend in the vertical direction, making the bridge very strong.
Digging Deeper
Have you ever tried bending a ruler? If so, you probably bent it in the “thin” dimension and not the “thick” dimension. It is much easier to bend one way than the other! In general, the shape of a material can dramatically affect its strength. Engineers take advantage of this fact when building bridges or other large structures. Most of the metal beams that support them have hollow cross-sectional shapes like circles, squares, or letters like “C,” “U,” or “I.” These beams are very resistant to bending, but require far less material than a completely solid beam. This makes them more lightweight and less expensive, since less material is required. Alternatively, given a limited amount of material, you can make it very strong depending on how you shape it. This is what you discovered when building a bridge out of a single sheet of paper in this project. A flat piece of paper is very easy to bend, so it makes a very poor bridge. By folding the paper into different shapes, you can make a much stronger bridge, even though you did not add more material.
For Further Exploration
- Try building bridges from other household materials, like aluminum foil, wax paper, or cardstock. Which material is the strongest?
- Experiment with different shapes. What happens if you roll a piece of paper into a cylindrical tube, or fold it into a “W” shape?
- Try making a longer bridge by taping two pieces of paper together end-to-end. How long can you make your bridge before it collapses under its own weight?
Monday March 30, 2020 – Make a Balloon-powered Nanorover
Courtesy of https://spaceplace.nasa.gov
Download this activity as a PDF here.
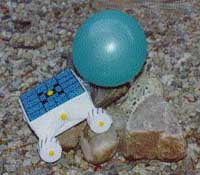
Roving a mini-“planet” calls for a “mini-rover.” NASA built a tiny rover just a couple of inches high to explore the surface of an asteroid and take pictures.
You can build a nanorover too. Try this one, made from three styrofoam meat trays.
This project is a little bit hard, so you might want to ask a grown-up or big brother or sister to do it with you.
What you need:
- Three large styrofoam meat trays (at least 9 x 11 inches)
Important! If the meat trays have been used, be sure to wash them very thoroughly with hot, soapy water first. It’s also a good idea to use bleach to kill any remaining bacteria (ask an adult to do this).
- Ruler
- Four flexible plastic drinking straws
- Three small (10-inch) bamboo skewers (for making shish-ka-bobs)
- Seven pea-sized blobs of clay or Play-doh©, or seven small gum drops
- One large wire paper clip
- One small (7-inch) party balloon
- One small rubber band
- Transparent tape (not the removable kind)
- Printed pattern, decals, and wheel treads (all on 2 sheets of paper)
- Ball point pen (for tracing around pattern)
- Scissors (for cutting paper pattern pieces and styrofoam)
- Small knife (for scoring styrofoam on fold lines)
- Lots of patience and—maybe—a grown-up (or teen) assistant!
What to do:
1. Print out pattern sheet, plus sheet with top and camera decals and wheel treads. Cut out pattern pieces, top decal, camera decal, and wheel tread strips.
2. Place pattern pieces on styrofoam trays (avoid curved areas on edges) and trace around them with the pen. Be sure you have traced the correct number of pieces: 2 body pieces, 8 wheels, 4 wheel struts, and 2 shoulders.
3. Carefully cut out the styrofoam pieces. Make the wheels as perfectly round as you can and all exactly the same size.
4. Mark the exact centers of wheels by poking the tip of a bamboo skewer through the mark on the pattern and into the styrofoam. Also, mark the holes on the body pieces, wheel struts, and shoulders the same way. Mark the fold lines just on the very edges of the body pieces.
5. On the body pieces, use the ruler and the small knife to score (cut just part-way through) the pieces on the fold lines.
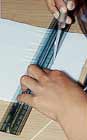
6. Now, fold the sides (the flaps) down on the score lines to make each piece into half of a box.

7. Tape the sides together on the inside to make corners stay put.
Hint: For most taping jobs (except on the wheels), you will find that long pieces (about 2 inches) of tape work best.

8. Put the two halves of the nanorover body together to make a box and tape corners and edges on outside.

9. Using the sharp end of a skewer, poke holes in the exact center (as marked on the pattern) of two opposite sides of the body.
10. Now, poke the sharp end of a bamboo skewer through the mark on one of the shoulder pieces, then through the smaller mark on each of two strut pieces.
11. Now, insert the skewer into one of the holes you made in the side of the nanorover body. Looking through the little hole in the opposite side of the nanorover to help you line up the skewer, poke the skewer the rest of the way through the body.
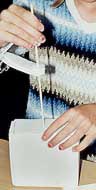
12. Finally, thread the other two struts and the other shoulder piece onto the skewer.
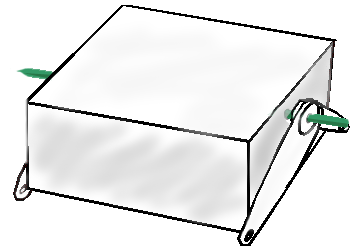
Leaving about 1/2 inch of the skewer sticking out on both sides, carefully cut or break off the excess length of skewer. Put a blob of clay or Play-doh, or a gum drop, on the ends of the skewer.

13. Now decide which is the bottom of your nanorover body. Line up the free end of each strut with a bottom corner of the nanorover body and use the ballpoint pen to poke good-sized holes in the smaller ends (will be near the larger hole marks on the pattern). You want to position these holes so that when the drinking straw “wheel axle” is threaded through them, the straw will fit right against the bottom front and back corners.
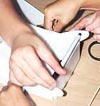
14. Thread a straw through the holes in the front struts and another straw through the holes in the back struts. Tape the straws to the bottom edges of the nanorover body. Trim the straws so they stick out about 1/4 inch beyond the struts on both sides.
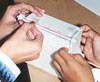
15. Look at the picture below as you follow these directions for assembling the wheels:
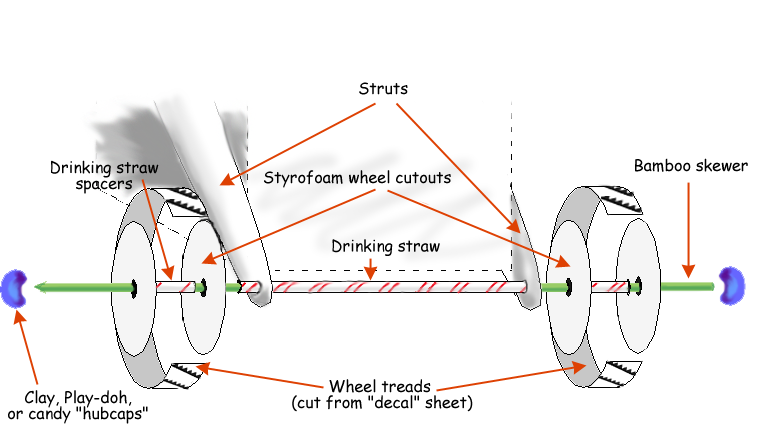
- Put two styrofoam wheels together to make a form and wrap one of the paper “tread” strips around it, taping the end.

- Take the styrofoam wheels out of the tread strip, which we will now call a tread circle. Set the tread circle flat on the table and drop one of the styrofoam wheels into it. The styrofoam wheel should lie flat on the table with the tread circle surrounding it. Tape the wheel to the tread circle from the inside. This makes the outside of one wheel.

- Poke the sharp end of a bamboo skewer through the exact center of this styrofoam wheel. Cut a small piece (about 3/4 inch) from one of the straws. Slide this piece onto the skewer and into the inside of the wheel you are making. Now slide another styrofoam wheel-through its exact center-onto the skewer and right against the tread circle and drinking straw spacer (to make the inside surface of the wheel). If the spacer is too long and prevents the inside wheel from resting against the tread circle, slide the piece of the straw off the skewer and trim it a bit.
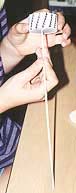
- Tape this second styrofoam wheel onto the tread circle using four small pieces of tape.
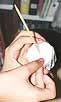
- Slide the skewer with its wheel through one of the straw axles already attached to the body of the nanorover.
- Make the second wheel as you did the first one, sliding it onto the skewer after taping the first styrofoam wheel onto the tread circle, then adding the straw spacer, and the second styrofoam wheel.
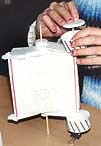
- Put a blob of clay (or Play-doh or a gum drop) onto the blunt end of the skewer.
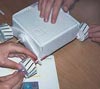
- Adjust the spacing of the wheels and straw on the skewer so that there is about 1/4 inch between the ends of the straw and the wheels. Be sure the wheels do not touch the straw, or they will not turn easily. Carefully break or cut off the excess length of skewer on the sharp end, and put another blob of clay or a gum drop on that end.
- Repeat for the second set of wheels.
16. Blow up the small balloon once or twice to stretch it out a bit.
17. Bend the last straw at its flexible neck. Use the rubber band to attach the balloon securely to the end nearest the bend in the straw.
18. Tape the long part of the straw to the bottom of the nanorover, crosswise to the wheel axles. Tape the short end with the balloon against the front (or back—it makes no difference) of the nanorover.
19. Color the top “decal” to look like solar cells (dark blue) or any color you like. Tape the decal to the top. You can make “double-sticky” tape loops for this job so the tape doesn’t show on the decal.
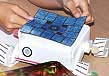
20. Tape the camera lens decal to the back or front of the rover. (On the real rover, it is on the front; on your rover, you might imagine the balloon, which is on the front, might get in the way of the camera!). Use a small double-sticky tape loop for this job too.
21. Straighten out half the large paper clip. Poke it through a blob of clay or a gum drop, then through the circle on the top to make an antenna.
22. Blow up the balloon through the straw, put your finger over the end of the straw, set the nanorover on the floor or a clear table and let it go. You may find that the nanorover goes better on a smooth, hard surface, than on carpeting.
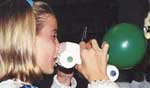
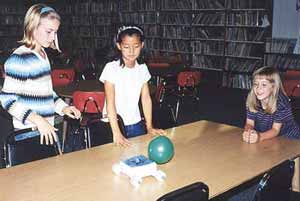
Your nanorover won’t go very fast, but it still goes faster than the real one!
Friday March 27, 2020 – Make a Cloud in a Jar
Courtesy of https://littlebinsforlittlehands.com
Ever look up into the sky and wonder how clouds form? Or have you ever flown through the clouds in a plane and thought how cool is this? Weather activities like this cloud in a jar can be so fun and simple and spark curiosity in kids. We have plenty of simple science experiments with a weather theme for all year round as well as spring STEM!
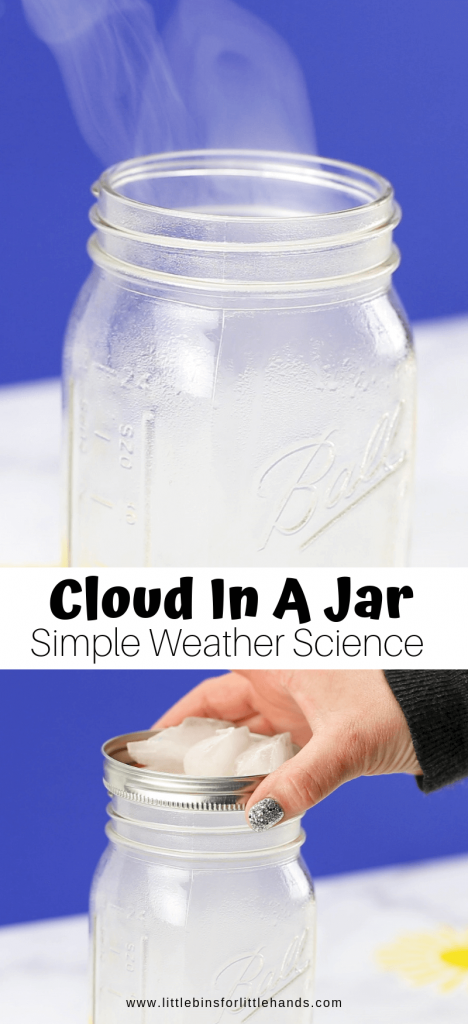
Get ready to add this simple cloud in a jar activity to your weather science lesson plans this season. If you want to learn all about how clouds are formed, let’s dig in.
Grab a few simple supplies from around the house and be prepared to amaze your kids.
This cloud science experiment asks the question: How does a cloud form?

YOU WILL NEED:
- Warm water
- Jar with a lid
- Ice cubes
- Aerosol hairspray
- An adult
CLOUD IN A JAR DIRECTIONS:
STEP 1: Pour warm water (not boiling) into the jar and swirl it around to warm the inside of the whole jar.
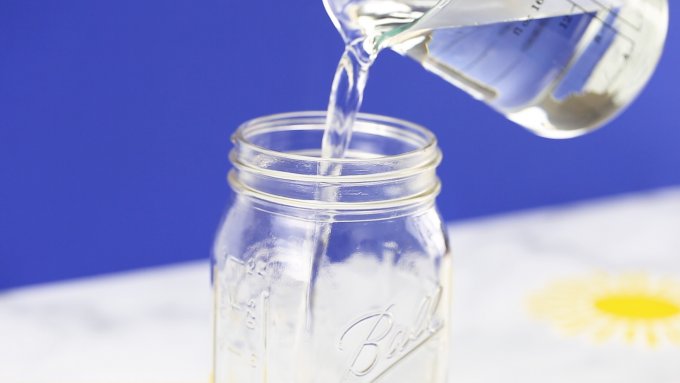
STEP 2: Turn the lid upside down and place several ice cubes on top of it. Place the lid onto the jar.

STEP 3: Quickly remove the lid and give a quick spray of aerosol hairspray. Replace the lid.
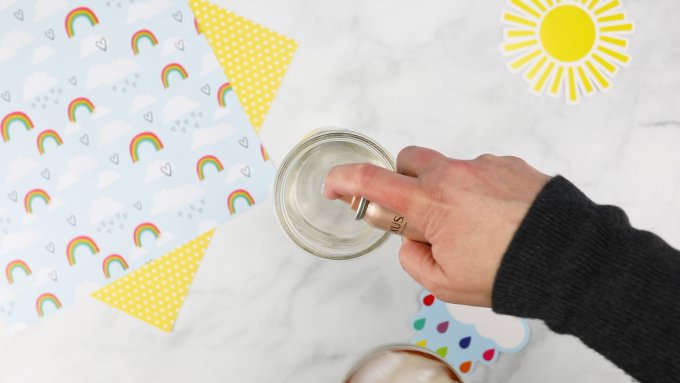
STEP 4: Remove the lid and watch the cloud escape!
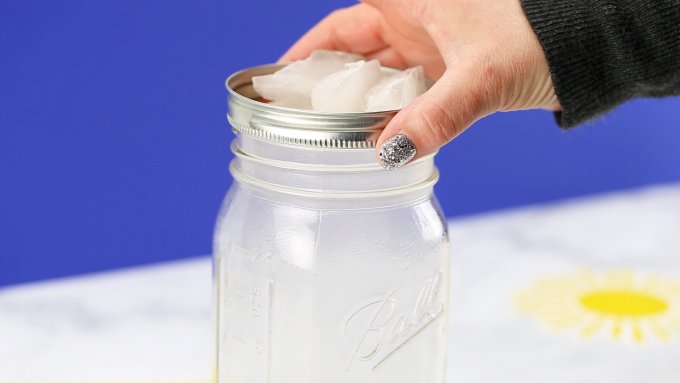
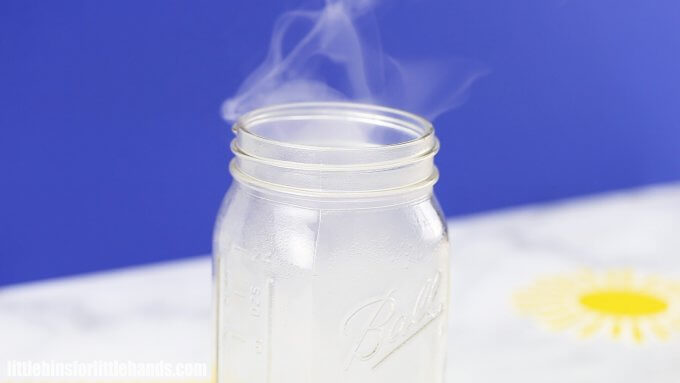
The water does not need to be boiling and it’s actually best if it isn’t because it will fog up the jar too quickly. You might choose to do this near an area where you can have a dark, bright surface for the kids to better view their clouds.
This could easily be a fun partner science activity too!
Why not test what happens when you add cold water to the jar instead of hot water. This will help kids to better understand why both warm air and cool air are needed to form the cloud!
HOW ARE CLOUDS FORMED?
Three things are needed to make a cloud. First, you need warm moist air. Next, you need a cooling process. Lastly, you need a cloud condensation nucleus or something to start the cloud. An example of this could be a dust particle!
By pouring warm water into a jar and trapping it, you create the first step which is warm, moist air. This warm air rises and meets with the cool air at the top of the jar which is made by the ice cubes.
The aerosol hairspray provides the cloud condensation nuclei. As the water vapor inside the jar cools down, it begins to form around the hairspray nuclei into many droplets. When you remove the lid, the swirling cloud is released!
Thursday March 26, 2020 – Make a Pinwheel Galaxy Pinwheel
Courtesy of www.spaceplace.nasa.gov
Download a PDF version of this activity here:
Make a Pinwheel Galaxy pinwheel
The Pinwheel Galaxy is a spiral-shaped galaxy about 21 million light years away from Earth. Scientists call this swirling galaxy M101.
You can find it in the constellation Ursa Major, or the “Big Dipper,” in the Northern Hemisphere. With a nice, dark sky, you can see it with binoculars or a small telescope.
For those of us who can’t see it in the night sky, we can have the next best thing: a Pinwheel Galaxy pinwheel!
What you need:
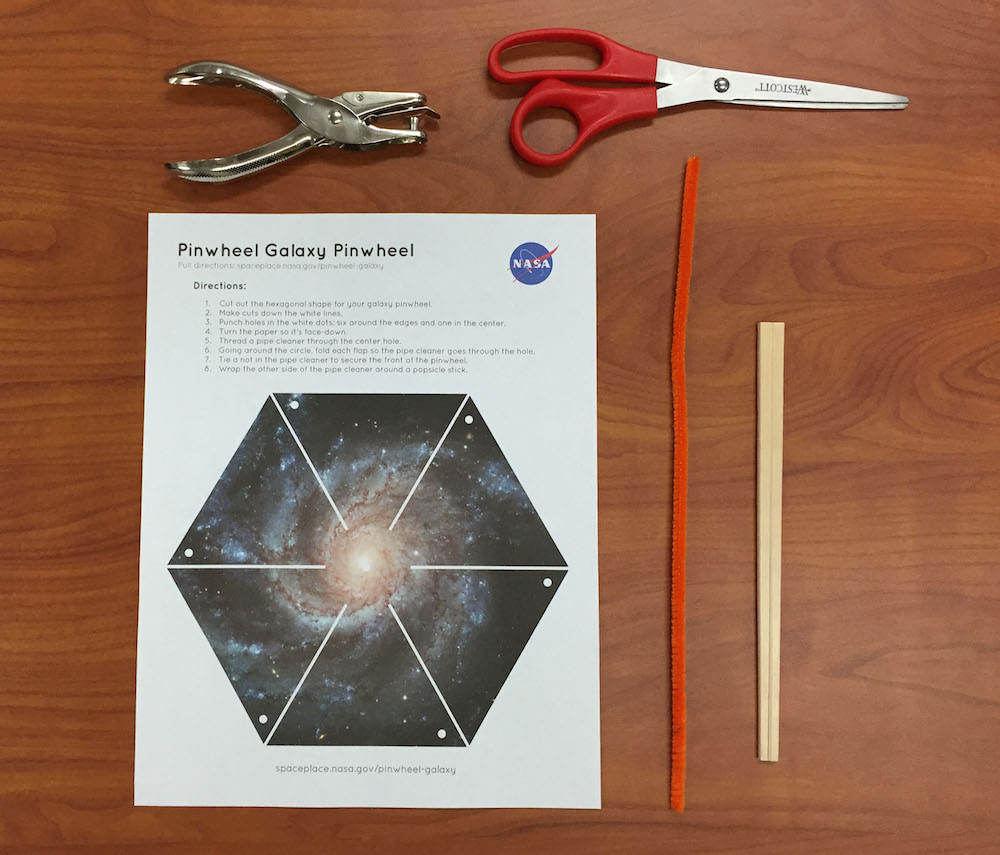
- Pinwheel Galaxy Printout (PDF)
- Pipe cleaner
- Popsicle stick or chopsticks
- Scissors
- Single hole puncher
What to do:
- Cut out the hexagonal shape for your galaxy pinwheel.
- Cut along the white lines.
- Punch holes in the white dots: six around the edges and one in the center. You may have to fold the hexagon over to reach the center.
- Turn the paper so it’s face-down and thread the pipe cleaner through the center hole.
- Going around the circle, fold each flap so the pipe cleaner goes through the hole.
- Tie a knot in the pipe cleaner to secure the front of the pinwheel.
- Wrap the other side of the pipe cleaner around a popsicle stick. Don’t make it too tight, or it won’t be able to move.
- Blow on it and watch the galaxy spin!
Wednesday March 25, 2020 – Design and Build Your Own Spacecraft
Courtesy of www.spaceplace.nasa.gov
Design and Build Your Own Spacecraft – Printable Copy
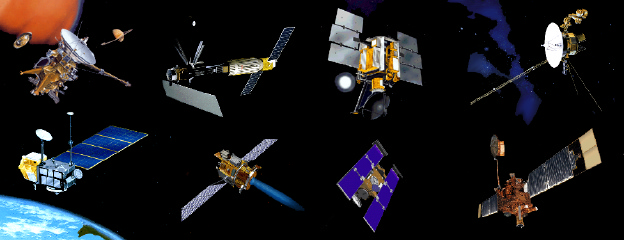
Design and build your own model spacecraft. Make it out of any materials and objects you find. We’ll give you a few suggestions.
Most spacecraft have parts that do certain jobs. Here are some of the parts and jobs they do:
• A container (like a box) to be the body f the spacecraft and hold the computer and electronics. This part is called the spacecraft “bus.”
• Something to keep the computer and electronics warm out in cold space (for example, a space blanket).
• Something to supply electric power (for example, solar panels).
• Some instruments to make science measurements or take pictures.
• Some way to communicate with Earth (both to send data and to receive commands).
• Some way to slow down, speed up, or change the direction of the spacecraft (like thrusters) to keep it on course or in the right orbit.
• Something to let the spacecraft know where it is and where it is going (for example, a star finder camera; for Earth orbiters, it might be a receiver for signals from the network of Global Positioning Satellites).
There are many other parts, but the ones above are some of the basics.
The spacecraft you design can be small or large. Here are some examples of materials you might use. This list is just a start. Use anything you can find.
• Juice box, gelatin or pudding box, shoe box, large cardboard box or carton, cardboard tube.
• Aluminum foil, foil gift wrap paper, construction paper, butcher paper, any kind of paper colored with paint or crayon, flat pieces of cardboard, transparent colored plastic film (for example, mylar).
• Popsicle® sticks, wooden skewers, wooden chopstick, yardstick; bamboo plant stakes, pencils, any kind of sticks.
• Styrofoam or paper egg cartons, small styrofoam balls, clay, paper cups.
• Paper bowls and plates, plastic bowls, Frisbee® disks.
• Cotton swabs, screws, bolts, paper clips.
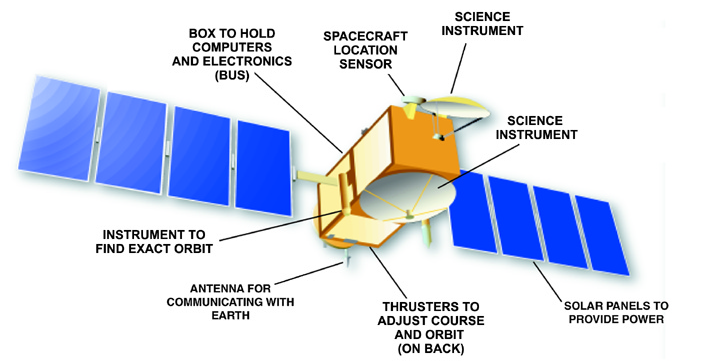
Earth and study the oceans. It will join its older sibling, the TOPEX/ Poseidon
spacecraft. TOPEX/Poseidon has been studying the oceans since 1992.
• Metal soup spoons or soup ladles.
• Push pins, thumb tacks, loose leaf brads, wood screws.
• Fishing line, thread, or string to hang model spacecraft in “space.”
• Scissors.
• Tape.
• White glue.
• Poster Tac® (reusable plastic adhesive), plasticene clay, or some other sticky stuff to attach parts.
A Special Spacecraft to Study the Oceans
Most Earth-orbiting spacecraft look similar to one another because they all need to communicate with Earth, make power, and carry instruments. Countries all over the world work together to build these spacecraft and study the data they send back. Earth is very complex, so using a view point from space, we are measuring many types of things, including clouds, the amount of sun reaching Earth, the temperature of the land and the ocean, sea surface height, and ocean color. Collecting information over the oceans is especially important.
The oceans are very, very important to life on Earth, because more than three-fourths of Earth’s surface is ocean. Not only are oceans the source of all our water and much of our food, they greatly affect the air we breathe and the weather.
Because the oceans are so enormous, we use spacecraft in orbit around Earth, as well as ships and buoys, to collect information. Jason- 1 will measure the height of the sea surface. To do this, it uses an instrument called an altimeter (al-TIM-uh-ter). The altimeter works by sending down a signal to the ocean. The signal bounces off the surface of the water and returns to the spacecraft. Since we know the height of the spacecraft very precisely, if we measure how long it takes the bounced signal to return to the spacecraft, we know the height of the ocean. Water in the air (for example, the water in clouds) slows down this signal. So we need to correct the measurement with information from another instrument called a radiometer (ray-dee-AH-muh-ter), which measures the amount of water in the air. These two instruments work together to give a measurement accurate to within 4 centimeters (about 1-1/2 inches).
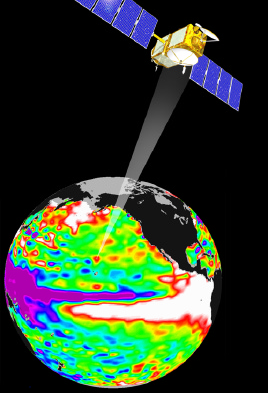
Why do we care how high the ocean surface is? The surface height of the ocean tells us how warm or cold the water is below the surface. Warmer water expands a bit, making the ocean surface higher. Where Jason-1 detects a rise in the ocean surface of 1 centimeter (4/10 inch), the top 50 meters (164 feet) of ocean is 1 degree Celsius (1.8 degrees Fahrenheit) warmer than the surrounding water.
These ocean “hills and valleys” tell us how the heat is moved around the oceans. Large amounts of heat moving from one place to another can affect the weather. We get more evaporation from hot water than from cold water, so with hot water comes increased rainfall. In the Gulf of Mexico, people watch the movement of warm eddies very carefully, because if a hurricane goes over one of these warm eddies, the wind speeds in the hurricane can actually get even faster!
This spacecraft will join several other ocean-watching spacecraft. They will help us understand how the oceans change over time and how those changes affect the climate and weather everywhere on Earth.
HAPPY BUILDING!
Tuesday, March 24, 2020 – Grow Your Own Salt Crystals
Courtesy of www.sciencekids.co.nz

Have fun growing your own salt crystals with this simple project. You can do further research with a microscope once you’re finished. Crystals are beautiful to look at and you might even want to start your own collection.
What you’ll need:
- A jar
- Water
- About half a cup of salt
- A spoon for stirring
- String
- Scissors
- 2 toothpicks
- A helpful adult
Instructions:
- Fill the jar with water.
- Add about half a cup of salt to the water.
- Mix the solution together with a spoon.
- Cut a piece of string with scissors and tie each end to a toothpick.
- Place the string over the top of the jar so that the string dangles into the middle of the solution and the toothpicks hang over the edge.
- Don’t forget to clean up when you’ve finished.
What next?
Leave the experiment and wait for salt crystals to form along the string. They are an excellent example of cubic crystals and you can do further research with them by examining them under a microscope.
When you look at various crystals under a microscope you can examine the differences between them: Are they perfectly formed? What shape are they? What color? Can you see any microorganisms on the crystals?
Crystals can be found grouped together as lots of small crystals or as huge individual crystals. They vary in size from those at the microscopic level all they way up to crystals that are meters in length!
Try collecting a range of crystals for your project, label the different types and make a rock collection box to keep them in.
Monday, March 23, 2020 – Relative Sizes of Planets
Courtesy of www.researchparent.com
I’ve always been fascinated by space. When I applied to college, I actually listed Astronomy as my intended major. Something about the vastness of the universe and the insignificance of our little planet on a cosmic scale brings me comfort. How can my problems possibly be worth stressing out over when I think about what happens outside of my narrow little universe, let alone the ACTUAL universe?
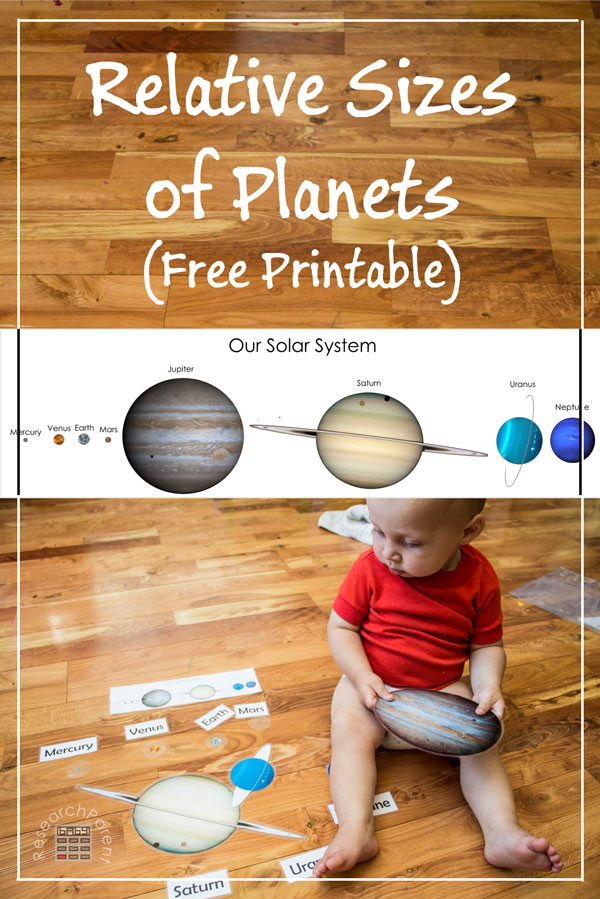
I made this hands on activity as a way to show my kids how tiny planet Earth is with respect to other planets in our solar system. (I’ll save the mind-blowing discovery that those planets are small compared to the sun and that our sun is just an average, little, insignificant star in our galaxy for another day.) I used Wikipedia’s data regarding the radius of each planet, so I’m fairly confident of the printable’s accuracy, though I will happily fix it if an error is discovered.
There are a several different ways to use this printable. A young child can just hold them and examine them, possibly while reading a book about space that talks about each of the planets such as this Little Kids First Big Book of Space by National Geographic. By being able to manipulate them and compare them directly, they will get a better idea of the relative size of each planet.
Older kids can try to memorize the names of all the planets and the order of the planets in terms of distance from the sun. A control card is included in the printable for the kids (or parents) to use as reference. For older kids, I recommend National Geographic’s Space Encyclopedia. For kids that need to move around to learn, I might hide the planets around a room and make the child hunt for them, then match them up to the control card so that they will be able to tell when they’ve found them all.
Recommended Age Range: Preschool, Kindergarten, Elementary, MiddleSchool, High School
Time Required: ~1 hour
Difficulty: Easy
Cost: About $1 in used supplies (though could be even cheaper if lamination was done with contact paper.)
Materials:
- Paper (for printing Relative Sizes of Planets printable)
- 5 Laminating pouches (optional)
Supplies & Tools:
- Printer
- Scissors
- Paper trimmer (optional, but it makes cutting the straight lines easier)
- Laminator (optional)
- Circles template (or a quarter or bottle cap in a pinch)
- Pen or marker
Instructions:
- Print out Relative Sizes of Planets printable. (Note: Last page does not need to be printed. It just contains legal information about sharing and where the images came from.)
- Cut out each planet, name label, and “Our Solar System” control card.
- Laminate everything with laminating pouches or contact paper. Not that the 4 smaller planets are so small, that before cutting them, I used a marker and circle template to draw a bigger circle around each one so they would be harder to lose.
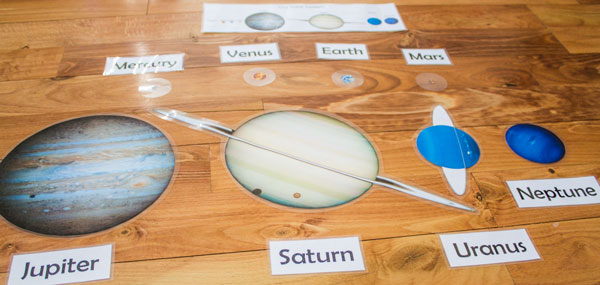
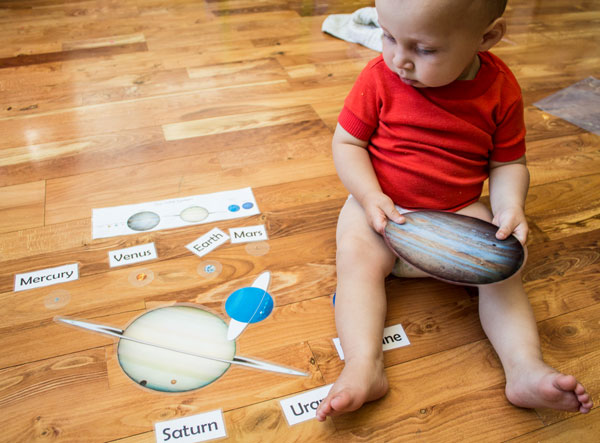
HAPPY LEARNING!