
January 20, 2008
There are 2 chart sets here. Peter did them and feels the second is better than the first. I can’t see a difference. However, the one for Jan. 06 came right on top of the solar magnetic reversal, as indicated by Sunspot 981. It shows the ‘old’ magnetic field right before the sun went into its new cycle. January 20 is 2 weeks later and is reversed. Note how all the lines are ‘opposite’ each other, like opposing, standing waveforms. I have sent this to Stanford and maybe we should wait for a reply as to the analysis.
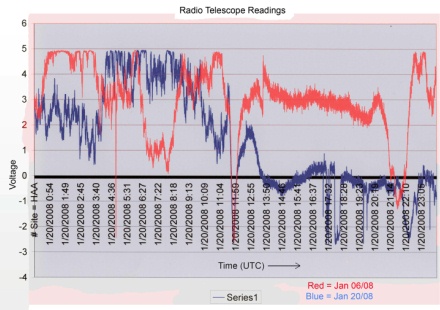
[LOFAR II data collected and reported by Mike Jefferson.
Chart of LOFAR II data refined by Peter McHugh.]
January 18, 2008
Right now, we have ~ 690,000. As of this time tomorrow night, we will have 700,000+, unless something goes suddenly haywire!! Pray! By next meeting, we should be in excess of 1,000,000 by 2 days’ worth!
January 6, 2008
This chart of January 06/08 UTC is very interesting because of the high voltage levels between the sunrise dip (centre) and the sunset dip (right). Normally the trace would run much closer to the 0-line, slightly above and below it. In this observational log it indicates, not individual solar discharges, but a temporary large increase in solar x-ray radiation – a surge. However, several of the high, intense and dogtooth peaks may be large, individual discharges inside the surge of x-ray radiation. The ionosphere remained quite charged up for several days following. -Mike J. (HAA – observing 24 hr.s/day everyday)
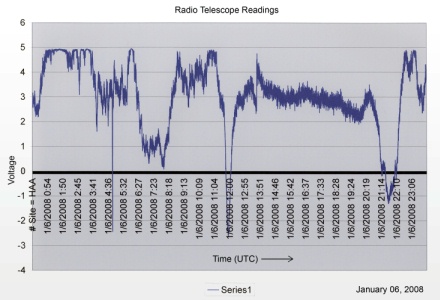
[Chart of LOFAR II data refined by Peter McHugh]